What Do You Do for An Encore? Globe’s Six Month Results

When revenues rise 60.3% (from $77.8 to $124.8 million- Australian dollars of course) and net profit is up 292.9% from $3.9 to $15.3 million for the six months ended December 2020 compared to the same period in the prior year, I’m not left with much to analyze.

That’s especially true with Globe.  As a public but closely held company it has never been forthcoming with information on exactly how it has pulled off its results.  This time is no different.

Read more

Globe’s Year- And I Tease Out the Six-Month Numbers

The headline is that given the pandemic, Globe had a reasonable result for the year ended June 30, 2020 and ended with a strong balance.  In the press release, they say their performance held up “adequately.”  That’s a fine word to describe it.

Australian accounting rules only require six months statements, rather than the quarterly ones we see from U.S. companies.  When they come out with the year end statement, there’s no requirement that they include the second half of the year separately, and they don’t.

Unfortunately, that leaves me having to find those numbers the hard way, which I’ve done.  They are in the chart below.
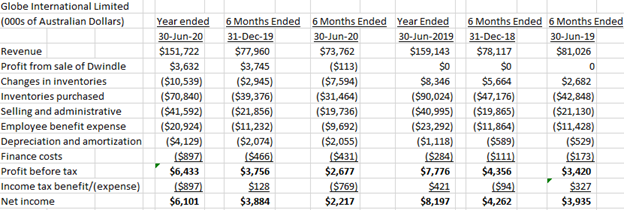


Pretax income for the year ended June 30, 2020 fell 17.3% compared to the prior fiscal year from $7.776 to $6.433 million.  However, the 2020 result included a profit of $3.632 million from the sale of the Dwindle brand trademarks.  Interestingly, the transactions costs associated with doing the deal were $1.631 million.

Globe also received some money from Australian government stimulus programs including one called JobKeeper.  They don’t tell us the amount.  I think we can assume it was received in the second half of the year.  The program has been extended to March 28, 2021 so more payments may be received.

If we remove the one-time profit from the Dwindle sale, pretax profit was $2.801 million, a 64.0% decline from the previous year.  If we knew what payments they received from the government, we’d have a better idea of operating results.

Despite the decline in income, revenue for the year fell only 5%, as you can see in the chart above- largely the result of the sale of the Dwindle brands.  Globe sold Dwindle- a decision I’ve always thought a good one-to focus on what it calls its strategic growth brands.  These brands- “…FXD, Impala, Salty Crew and Globe Skateboards all recorded sales growth compared to the prior comparative period.”

Gross margin fell by just 0.3% helped, I imagine, by the sale of Dwindle.

Globe suffered from, and reacted to, the pandemic much like other industry companies.  In the six-month ended June 30, Globe had a pretax profit of $2.677 million, down 21.7% from the prior year’s six month.  Revenue fell 9%.  You can see they reduced expenses and purchased less inventory.  Here’s what they tell us about how they managed when the virus hit during the second half of the year.

“There were a number of negative impacts on the business as a result of lockdowns which resulted in restrictions on the supply chain, operations, wholesale customers and end consumers. However, partially offsetting these negative impacts, there were also a number of positive factors that affected profitability. This included savings from short-term salary reductions, including at the executive level; discretionary and renegotiated cost savings; government stimulus received (including JobKeeper in Australia); rent relief from landlords; and sales growth in certain categories that continued to sell well online throughout Q4.”

For the year, Australasia revenues fell from $81.977 to $79.333 million, or by 3.23%.  EBIT was down 15.5% declining from $13.176 to $$11.134 million.  “The decline in Australian revenues was driven by its licensed Streetwear division, which was the Australian business unit that was hardest-hit by COVID-19.”

The North American segment reported a year over year revenue decline of 12.6% from $53.479 to $46.768 million.  EBIT improved, rising from a loss of $144,000 to a profit of $2.656 million.  This reflects the positive impact of the Dwindle sale.

In Europe, revenue rose from $23.656 to $25.598 million- 8.2%.  But EBIT fell 80.8% from $1.094 million to $210,000.  “…the earnings were lower as a result of extra costs to grow these brands in their earlier stages of development and a decline in gross profit margins, mainly due to the stronger USD.”

I’ve already noted that the balance sheet remains strong.  They ended the year with cash of $26 million, up from $9.5 million at the end of the previous year.  Even as I’ve grumbled about the paucity of information in their reports, I’ve always recognized that Globe was pretty damned good at recognizing inflection points and making required changes.  Doesn’t look like this year, and half year, was any different.


Globe Sells Dwindle and Files Its Annual Report

Globe filed its annual report for the year ended June 30, 2019 pretty much concurrently with the announcement that it had sold Dwindle to Highline Industries Corporation.  Skatewire reported that the purchase price was $1.5 million, but what the annual report says is that the carrying value of the assets was $1.5 million.  I haven’t seen the purchase reported anywhere.  The transaction will close and be accounted for in the first half of Globe’s current fiscal year.  If you haven’t, you might also read the interview with Bod Boyle and Steve Lake on Shop Eat Surf about the deal.

According to Globe’s annual report, “The transaction includes the brands, working capital, domain names, social media accounts and the personnel attached to the Dwindle business.”  Maybe they shouldn’t have worded it so it sounds like they sold the employees.

Read more

Thanks to Their Australasia Segment, Globe Has a Solid Six Months

Globe reported growth in revenue and income for the six months ended December 31 though, as usual, they don’t give us much information on how they did it.  I’ll tell you what I can glean from the public documents.  All numbers in Australian dollars of course.

Read more

Globe Had a Good Year- But It’s Hard to Tell How They Did It

I like Globe.  They’ve always had a good attitude, have been able to spot opportunities, and have acknowledged and moved to correct mistakes when they happened.  They are, as a result, a company I want to write about because I think we might all learn something.

Unfortunately, their required statutory report for the year ended June 30, 2018 is somewhere between not much and no help.  How can a 60-page report not even list the brands they own and tell us at least a bit about how they are doing?

The answer is that Globe is closely held by the Hills, has few shareholders, isn’t closely followed by the analysts and, last but certainly not least, is operating under Australian accounting rules.  I may not like the paucity of information, but in their place, I’d do the same thing.  Let’s see if I can glean a bit of useful data from what they do tell us.  Remember, all numbers are in Australian dollars.  One Australian dollar will cost you around 72 U.S. cents.

Revenue rose $7.2 million (5.16%) from $140.5 to $147.7 million.  All the growth happened in the second half of the year.

Revenues in Australasia rose 1.75% from $77.1 to $78.4 million.  EBITDA grew from $12.2 to $14.6 million, or by 19.7%.  The rise in EBITDA, we are told, was mostly driven by “…sales and profit growth in the workwear division.”

North American revenues were up 10.5% from $42.0 to $46.4 million.  EBITDA in that segment went from a loss of $1.25 million to a profit of $1.56 million.  “This turn-around was a result of the restructuring that was completed during the 2017 financial year, as well as an 11% increase in revenues driven by new apparel initiatives.”

Europe revenues rose from $21.4 to $22.9 million, or by 7.0%.  It’s EBITDA was $636,000, up 0.8% from $631,000.  All they tell us is that “The European business reported modest growth in sales and profitability.”  Well, that’s helpful.

What I hear is that workwear and apparel are responsible for most of the revenue growth.  Does that imply some stagnation in some of the hard goods driven brands?  How are shoes doing?

The gross margin rose 1.4% “…driven by sales mix and favorable foreign exchange impacts.”  Using Globe’s “Revenue from operations” number and what they call “Cost of sales” in Note 4, I calculate a gross margin as having risen from 45.8% to 47.8%.

I am sure they are right and that I don’t understand what “Cost of sales” includes.  But the calculation I did gives a better result than what they report.  Obviously, cost of sales can include more costs than the expenses included in gross margin, but if that was true then wouldn’t my calculated “gross margin” be less than what they reported?

Moan.  I need a footnote to the footnote.

Selling and administrative expenses rose 7.9% from $36.6 million last year to $39.5 in the most recent year.  Employee benefits expense was down very slightly to $21.4 million.  Net income rose 66.1% from $5.08 to $8.4 million.  There’s no discussion of the changes. The balance sheet is solid.

I want to thank Globe for providing a report that made it impossible for me to spend much time analyzing it.  I confess I don’t entirely miss having Billabong’s public filings to try to figure out every six months.

Globe seems to be a company changing its focus to apparel and workwear.  Not a surprise given the current state of growth opportunities in hard goods. They are managing the transition while keeping the balance sheet strong and earning more money.  There is something about their culture that makes them early recognizers of market changes and willing to act on that knowledge.

Revenues Flat, But Strong Bottom Line Performance; Globes Half Year Results

Globe’s report for the six months ended 31 December 2017, as usual, gives us very little information.  The only 17 page report makes just one incomplete mentions of their brands and tells us exactly nothing about how any of them are doing individually.

Perhaps I’ll start by reminding you of their brands.  They own are Globe, Salty Crew (50% I think), FXD, Dwindle, Enjoi, Blind, Darkstar, Almost, Tensor, Dusters and Sample.  Their third party brands, which means they distribute them, are Stussy, Obey, M/SF/T, Xlarge, Andale, Kryptonics and Hardcore.

Total revenue, compared to the same six months the previous year, fell by 0.71% from $70.7 to $70.2 million (all numbers are in Australian dollars).    Pretax income, on the other hand, rose 24.1% from $2.81 to $3.49 million.  How’d they do that?

“This growth in profitability was due mainly to an increase in gross margins across the board. The gross margin improvement came from a combination of factors including brand mix, customer mix, sourcing improvements and foreign exchange impacts. While overall costs were largely flat compared to the same period last year, there has been a reallocation of costs towards emerging and growth brands, to drive the growth in those brands over the coming years.”

Revenues from the Australasia segment fell from $41.3 to $38.3 million.  However, the segment earnings before interest and taxes (EBIT) was up just a bit from $4.95 to $5.06 million.  In North America, revenue rose 13.4% from $17.75 to $20.13 million.  The EBIT loss improved, declining 41% from a loss of $2.15 million to a loss of $1.27 million.  In Europe, revenues were little changes, rising from $11.68 to $11.76 million.  However, EBIT fell from $284,000 to $83,000.

From a bottom line perspective, then, Australasia is carrying the load.  North America is losing money and Europe is barely above breakeven.

I don’t know what the change in gross margin was.  Of the factors they point to as responsible for the improvement, I’d be curios how much foreign exchange accounted for.  But fundamentally, they leave us with a picture of a company that’s managing its brands, distribution and customers consistent with a competitive environment where revenue growth is harder to come by.  I’d call that being in touch with reality.  Globe has tended to be that way.

Changes in the balance sheet, which is strong, are consistent with management’s description in the quote above of what led to the gross margin increase.  With revenue more or less constant, we see an 8.6% decline in inventory from $19.2 million a year ago to $17.6 million at 31 December 2017.  I also note that a current interest bearing liability of $4.59 million last year is down to zero this year while cash and cash equivalents is basically unchanged.

Based on the very limited information in the report, Globe is positioned to do well if its competitors struggle for whatever reason.

Not Too Bad, But Not Too Good. And Generally Uninformative. Globe’s Annual Results

Globe is no more immune to economic conditions than any other company.  But what I’ve always liked about them is they seem to be in touch with reality and have a positive attitude about it.  They haven’t always been right (me neither) but they’re not slow to realize when something should change and in making it happen.  Their results for the year ended June 30, 2017 demonstrate that.

As usual, we don’t get very much useful information in their statutory report, and nothing by brand, but I’ll give you what I’ve got.

Read more

The U.S. is Tough on Another Company: Globe’s Half Yearly Results

Globe published its results for the six months ended December 31st on February 21st and I missed it.  Better late than never I guess.

Happily for Globe, its largest market in Australasia was strong because revenues in Europe and North American (NA) were down pretty dramatically.  Total revenues fell 10.6% from $79.1 in the six months last year to $70.7 million Australian dollars in this year’s six months. (all dollar numbers are Australian).  Australasia revenue, representing 58.4% of total revenue, rose 15.5% from $35.7 to $41.3 million.

Read more

Globe Reports Annual Results. How Was the Second Half of the Year?

Well, how nice to be reporting the results of an Australian company that’s making money.  Life was not as good for Globe in the second half of the year as in the first.  Still, it feels like they are doing most things right.

I suppose I should confess that they sent me a copy of their book called Unemployable, which is a history of the company.  It’s nearly 700 pages long and a large format book.  You would not want to drop it on your foot.  I read most of it.  Thank god it’s full of all those pretty pictures or I’d still be reading.

Read more

Globe’s Half Year Results- Serious Improvement, But It’s Hard to Figure Out Just What They Did Better

This is going to be a short article. On February 23rd, Globe reported solid improvement for the half year ended December 31, 2015. But I don’t have much to tell you in terms of what they did better or how because it wasn’t in the public information. Let’s go with what we’ve got. The numbers are in Australian dollars.

Revenue rose 19.5% to $78.8 million from $66.0 million in last year’s six months (the prior calendar period- PCP). There’s no cost of goods sold provided as there would be in the U.S.

Okay, I think maybe I’ve figured it out with a little help from people who understand the presentation of Australian financial statements better than I do.

Read more