Skullcandy’s Quarter and Year: Good Results, Same Strategic Issues and Opportunities

You recall that Skullcandy found itself in turnaround mode when it sold too much poor quality product in low priced distribution that wasn’t consistent with its preferred branding and market positioning. I suppose that happened when the newly public company tried to meet Wall Street growth expectations.

CEO Hoby Darling came in and put a stop to it. His five pillar strategy included, and continues to include, marketplace transform, create the innovation future, grow international to 50% of the business, expand and amplify known-for categories and partnerships, and team and operational excellence. I’ve reviewed each of those in detail in previous articles, and won’t do it again here. You can find his progress report in each one, as always, in the conference call transcript. And while I’m at it, here the link to the 10K.

Those pillars are all important and necessary. But to my mind marketplace transform was the essential first step, as the company pulled back from questionable distribution for the sake of growth and focused on working with the right retail partners in the right way. Note that this includes Walmart as well as specialty shops, and that tells us something about how the market has changed.

Because of progress in all five of those areas, financial results have improved and things look much better. But the company still has to confront the not insignificant competitive circumstances it’s faced since going public. If I were to sum it up, I’d say that I love what they are doing and have a lot of respect for the progress so far. However, it still feels like there might be some conflict between being a public company and the market position they want to have. We’ll look at the numbers, and then return to that issue.

Read more

Globe’s Half Year; The Plan Seems to be Coming Together

Back in 2002, Globe bought Kubic Marketing, the holding company for World Industries and Dwindle. It turned out that their timing couldn’t have been worse in terms of the skateboarding industry cycle. Just about the time they dug their way out of that glitch, the Great Recession hit and had the same kind of impact on Globe it had on other industry companies.

But for the six months ended December 31, 2014, Globe reported sales that rose 28.4% from $51.4 in the prior calendar period (pcp) to $66 million Australian dollars (all figures in Australian dollars). Net income was up from $818,000 to $1.58 million. They even reinstituted a dividend of three cents a share. That speaks well of cash flow.

Those results occurred while they increased SG&A and employee benefit expense by $6.7 million. Most of the increase was in SG&A.

The Globe brand, we learn in an investors’ presentation, rose 27% worldwide. Dwindle Distribution was up 16%, 4Front Distribution 22% and Hardcore Distribution 26%. They also started a new work wear brand called FXD.

Globe owns or distributes 25 brands. I suggest you go to their investor website here and download the investor presentation dated February 27th, 2015 to see which brands are sold by which distribution company. If you’ve been around the skate business even a little, you’ll recognize most of them.

Note that not all brands are sold worldwide.

North American sales rose 12% from $18.4 to $21.3 million. But earnings before interest and taxes (EBIT) in North America declined from a loss of $360,000 to a loss of $1.832 million. Neither the financial report nor the investor’s presentation explains what exactly happened in North America. They do say in the presentation that, “Segment result impacted by lower scale, margin pressures and introduction of new brands.”

I guess I know that “margin pressures” means gross margins were lower. “Introduction of new brands” might mean they spend a bunch of money on getting new brands started- specifically Fallen and Zero. No clue what “Segment results impacted by lower scale” means, especially as sales were overall up 12%. Maybe there’s a transcript that goes with the presentation, but it’s not on the web site.

They note that Dwindle hard goods and Globe apparel were up, but don’t say how much. I’m wondering how much growth there was in North America if we take out Fallen and Zero.

I’m also wondering how much sales grew in constant currency. Even at December 31, the Australian dollar was weaker against the U.S. dollar than in the pcp. In the presentation, they warn us that they “…expect the strengthening US dollar to have an impact on margins in Australia and Europe.”

Things were better in Europe. Net sales grew by 59% from $11.9 to $18.6 million. EBIT rose from $1.1 to $3.5 million.

In Australasia, sales rose by 23% to $26.3 million from $21.4 million in the pcp. EBIT was up 17.8% from $2.78 to $3.28 million.

The segment EBITs do not include certain corporate expenses and unallocated, unrealized foreign exchange losses that totaled $2.5 million in the most recent six months and $1.66 million in the pcp.

The balance sheet improved as equity grew by around one-third to $40.6 million. Current ratio at 1.88 was down a bit from 2.03 a year ago, but that’s fine. Receivables, inventory and payables have risen significantly, but it seems in line with the revenue growth.

The presentation notes that they have no borrowings, which is technically correct. But they are using a non-recourse receivables financing facility in North America in the amount of $2.5 million, up from $1.8 million in the pcp. Since it’s nonrecourse, it’s not debt but there is a cost to using it.

While Globe still has some work to do in North America, the overall result shows good progress. I just wish there was some more information on specific brand performance.

SPY’s Results for the Year and Some Thoughts on Their Market Position

As I’ve written before, I have a lot of respect for how SPY has restructured and repositioned itself. There seems to be an alignment of their corporate culture and market positioning that not only has the potential to differentiate the brand (in their market), but to save money and increase the efficiency of the organization.

Here’s how they put it in the 10K for the year ended December 31, 2014:

“We have a happy disrespect for the usual way of looking (at life) and this helps drive our innovative design, marketing and distribution of premium products, especially eyewear for youth-minded people who love to be outside doing what makes them feel most alive and happy. We feel a primary strength is our ability to create distinctive products that embody our unique, happy, and irreverent point of view, and this has helped us become what we believe is one of the most recognizable action sports and eyewear brands in the world, with a twenty-year heritage in surfing, motocross, snowboarding, cycling, skateboarding, snow skiing, motorsports, wakeboarding, multi-sports and mountain biking. We have a happy disrespect for the usual way of looking (at life) and this helps drive our innovative design, marketing and distribution of premium products, especially eyewear for youth-minded people who love to be outside doing what makes them feel most alive and happy. We feel a primary strength is our ability to create distinctive products that embody our unique, happy, and irreverent point of view, and this has helped us become what we believe is one of the most recognizable action sports and eyewear brands in the world, with a twenty-year heritage in surfing, motocross, snowboarding, cycling, skateboarding, snow skiing, motorsports, wakeboarding, multi-sports and mountain biking.”

So is irreverence really an attribute that can provide a competitive advantage? Think about that and we’ll get back to it after going over the numbers.

For the year, sales rose 0.9% to $38.1 million. Below is the breakdown of those sales by product line.

spy 12-31-14 10k image 1


The sales increase was due to increases in prescription frames and goggles. Sunglass sales fell by 5.7%, or $1.5 million. They say that decline was “…principally attributable to an overall decline in the consumer market, particularly during the second quarter of 2014, coupled with several key retailers currently holding lower levels of inventory, lower closeout sales of our sunglass products and the loss of a key account.”

I’d note that SPY gets 64% of revenues from the very competitive sunglass category (down from almost 69% last year. 16.5% of revenue internationally is low compare to a lot of other companies, but that may turn out to be a good thing given the strength of the U.S. dollar. A strong dollar means that SPY’s product cost falls (same for all internationally sourcing companies). But it also means that the dollar value of their internationally sold product comes down when translated. The more international sales you have, the bigger the currency related decline in those sales.

Gross profit margin rose from 49.9% to 50.6%. The increase was due to purchasing more product from China (instead of Italy) and having lower closeout sales, which fell from $2.8 to $2.0 million.

Sales and marketing spending grew by $0.2 million to $11.5 million. I see they spent more on marketing events and promotions. Good. Advertising expense rose from $394,000 to $540,000. Also good.

Meanwhile, SPY cut general and administrative expenses by 6.9% to $5.7 million. They did it by reducing bad debt expense $0.3 million through better collections and consulting and outside services by another $0.3 million. They took a chunk of those savings $0.4 million) and invested them in salaries. I assume for people who are doing productive things for the brand.

The result was operating income that grew from $399,000 to $890,000.

Below the operating line, there’s that inconvenient line “interest expense.” It declined from $2.97 million in 2013 to $2.5 million in 2014. Remember the interest rate was reduced significantly during 2014 and you’ll see that impact even more in 2015.

Largely as a result of that interest expense, SPY reported a loss for the year of $1.9 million, an improvement from the loss of $2.9 million the previous year.

In terms of revenue, the fourth quarter was stronger than last year’s quarter, with revenue rising from $8.6 to $9.8 million. The net loss was $423,000 compared to $1.265 million in last year’s quarter. That explains most of the improvement in the bottom line over the whole year.

Over on the balance sheet, there’s still that note payable to shareholder of $21.6 million, but it’s up only very slightly from $21.5 million at the end of the previous year. However, the line of credit rose from $4 million a year ago to $6.8 million at the end of this year.

The current ratio has fallen a bit from 1.6 to 1.3. I see that receivables rose 9.6% with sales up just 0.9% and their mention of collecting receivables better. And I see yearend inventory up 31% to $7.7 million. I wonder if that might not have something to do with lousy snow conditions up and down the West coast making it difficult to sell snow goggles.

If so, SPY is hardly the only company with that issue. I see they’ve increased their allowance for returns from $1.6 to $2 million, so maybe I’m on to something.

As we transition from the financials to strategy, I want to remind you of the licensing deal SPY signed. Here’s how they describe it:

“In December 2013, we entered into a merchandising license agreement, pursuant to which we licensed the SPY IP [intellectual property] to a third party…The agreement provides that the licensee shall develop, introduce, market and sell certain licensed products incorporating the SPY IP, including men’s and boy’s apparel, bags and luggage, consumer electronics, protective cases, and other unisex accessories, throughout North America through certain distribution channels, other than deep discount retail channels.”

They expect those products to start generating revenue this quarter, but don’t offer any clue as to how much. Wish I knew what SPY’s definition of “deep discount retail channels” was. I also wonder if these products will get sold into any existing SPY accounts and how that will get managed.

To get out of its balance sheet hole, SPY needs more bottom line earnings. Perhaps these royalties will make a meaningful contribution to that. Meanwhile, SPY is a small company in a market of some big companies with much greater resources than SPY. The traditional response of smaller companies in this situation is to position itself as a niche company, and I’d say that’s what SPY has done.

Here’s how they describe it:

SPY “…is a creative, performance-driven brand that is fueled by collaborative efforts across various facets of youth culture, including competition, art, music and day-to-day athletic performance. We strive to ensure that our in function and design, as well as style. We do this, in part, through partnerships with our world class athletes who help us design, then wear and test our products during training and competition. We believe that the intimate knowledge of our customers’ lifestyles is what helps us develop a stronger, more relevant product offering for our market. We reinforce our irreverent brand profile through unique and disruptive marketing, using traditional and non-traditional means to convey our branded point of view to both entertain and edify people…”

You can’t have intimate knowledge of your customer’s lifestyle if that customer base is very broad- especially as a small company. This is a bit of a conundrum for SPY, and for similarly positioned companies. You need growth, but as you move to broaden your existing market, you may start to lose the thing that has made you special to the existing customer base without attracting the new customers.

What I think may happen is that the attitudes and lifestyles of the millennial generation (larger than the baby boomers) may reduce this challenge. Facilitated by mobile/internet/omnichannel/ecommerce, etc. certain traditional issues of segmentation and perhaps demographics are, I think, going to become less important.

That’s where SPY’s opportunity may lie.

Billabong Turns a Profit; But There’s More Work to Do

Wow, this is going to be way shorter than most of my previous Billabong articles. Where’s the drama, the kind of hard to get your head around accounting, the recapitalizations and explanations thereof, the endless list of “significant items” I always complain about?

Gone. Mostly. Well, not all the significant items. Billabong is implementing their plan and running their business. The watch word that ran through the conference call was “transparent” and the call and documents really were.

We’ll get to the numbers. First, I want to show you and discuss a few quotes from CEO Neil Fiske.

“I think we’re getting better at running our operations, sometimes at the expense of pumping up top line sales, but with better margins…We tried to maintain a full price brand building, equity building business, and not chase volume for the sake of volume, where we’d dilute our margins.”

Long time readers know I’ve been recommending a focus on operating profit over sales growth (not specifically for Billabong) since sometime in 2008 when the Great Recession hit. You certainly leave the financial documents and conference call with the sense that Billabong has the chance to grow sales, but I suspect as they get more of their systems/supplier/logistics/ changes done, we’ll see efficiency improvement that will also help their bottom line.

Speaking of that, here’s the link to the Billabong investor page. You can review all the documents from the half year report and see the conference call transcript and presentation. If you want to. If you don’t, at least open the transcript and start reading two thirds of the way down page five with the paragraph that starts “Ultimately.” Read about two pages from there and see what they are doing with their systems, suppliers, and logistics.

What they are doing is really hard, really disruptive, really complex, and really necessary. Good for them.

“For the first time, we will have one system capable of supporting all our channels in all our regions, including brick and mortar, retail, catalogue, digital commerce, wholesale accounts and licensed stores.”

The goal is deploy the new platform in 12 to 15 months. That’s just one of the systems they are working on. They are also in the process of “…reducing our global vendor list from over multiple hundreds of suppliers to a much smaller group of preferred vendors.”

This is not just about buying some computers and software. That’s the easiest, though not easy, part. It’s aligning the people and processes to get the most out of those systems that’s hardest.

Those processes include “…tighter integration between merchandising and sales and marketing in our go-to-market calendar…” Neil notes that they are “Going to market with a point of view about what’s important, what we stand for and what we want them [the retailers] to get behind.

All things being equal, I’d expect these changes to offer opportunities to both increase revenue and cut costs as they come on line.

The Numbers

Let’s start with the “as reported” numbers. All numbers are in Australian dollars. As we do that, keep in mind they sold West 49 in February 2014 and SurfStitch and Swell in September of the same year. We’ll look at the numbers without them in a bit.

Revenue from continuing operations for the six months ended December 31, 2014 fell just slightly from $527.2 to $525.8 million. Gross margin rose from 44.8% to 45.2%. SG & A expense was down 1.85% from $217.2 to $203.2 million. The result was an operating profit from continuing operations of $12.5 million, a big improvement from a loss of $34.9 million in the pcp.

Net profit was $25.7 million, up from a loss of $126.3 million in the pcp. $71.4 million of that improvement comes from a change in income tax expense and has nothing to do with how the business operated. Interest expense fell from $57.2 million to $16.2 million as a result of the restructuring. Discontinued operations contributed an after tax profit of $10.5 million compared to a loss of $23.1 million in the pcp.

If you add up the changes in income taxes, interest expense and discontinued operations you’ll find that the improvement in net income as reported was only about $6 million excluding those items. It’s not quite as simple as that, but you can see what I mean.

Obviously, there was a lot going on and Billabong has helped us to isolate that so we can see how the business is doing. You know what the discontinued operations represent. The “significant items” generated income of $13.5 million in the most recent period. They were an expense of $65.6 million in the pcp. They are restructuring costs, deal costs, inventory write downs, and a host of other stuff. See footnote 4 in the financial statements if you’re interested.

We could have a long conversation about which of these should be included or excluded. Every company seems to have some new significant items or extraordinary events or one time charges pretty much every year. They have an impact on the bottom line. Some, I’m okay with excluding for the operating analysis. Others, not so much. Anyway, let’s just acknowledge that there’s a certain amount of art in this and move on.

Below are the segment revenues and EDITDAs including the items and discontinued operations.

Billabond 12-31-14 results chart 1


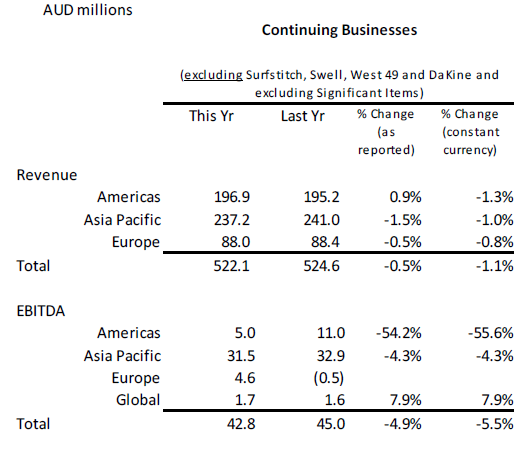
Next, from the presentation during the call, here’s a breakdown of revenue and EBITDA by geographic segment that excluded the significant items and sold businesses.

Billabong 12-31-14 results chart 2


You can see that revenues fell slightly as did EBITDA. The gross margin for the continuing business was 54.9%, down from 55.4% in the pcp.

In the Americas, Billabong and RVCA grew 9.5% and 5.7% respectively. There was weakness in the Canadian market and Element brand. There was $6.1 million less in wholesale business from West 49, who is now a wholesale customer. CEO Neil Fiske makes the interest comment that “…when we owned this business [West 49], we were pushing our family brands hard. Arguably with too much inventory and too little regard for the natural level of consumer demand.”

Comparative store sales were down 3.5% in the Americas, but only 0.4% in the U.S. The number of stores fell from 173 to 68 mostly due to the sale of West 49.

The good news in Europe is the strong performance of Element (we aren’t told exactly what that means) and the improvement in the gross margin from 49.4% to 55.9% after adjusting for the divestments. It was even a little better as reported. You can see the result above in the improved EBITDA. Neil says the improved margin was “…driven by better inventory control, improved merchant planning, margin management and a focus on higher quality distribution.” Comparative store sales were flat but store margins rose 1.7%. The number of stores, at 111, was down from 112 in the pcp.

Asia Pacific suffered from soft Australian retail sales.

It’s interesting that we still don’t hear much about their other brands. They do mention opening some Tiger Lily shops, but that’s it. I’d be curious to hear what’s going on with Sector 9 and Excel, among others. I still wouldn’t be surprised to see the sale of some other brands.

The balance sheet has strengthened enough as a result of the recapitalization that I’m going to pay them the compliment of not spending much time on it. Non-current liabilities have fallen from $512 million a year ago to $268 million at the end of December 2014. Equity has risen from $194 million to $311 million. If I wanted to pick around the edges a little, I might ask why receivables were actually up a bit given the decline in revenue. Maybe because of the growth of the wholesale business. Cash flow from operations was a positive $13.7 million for the six months compared to a negative $27.3 million in the pcp.

So “stabilizing,” the word Neil Fiske uses, is the right one to describe the continuing business. The profit turnaround is more about the taxes, interest and discontinued operations. However, a chunk of that represents benefits Billabong will continue to see- especially the interest expense reduction. The plan they are pursuing is the same one Neil announced when he took the CEO job, and it looks like they continue to move forward.


Kering’s Annual Report and Some Thoughts on Volcom’s Role.

Kering, the owner of Volcom and Electric, presented its annual results for 2014 last week and held the usual conference call. As regular readers know, I was impressed at the job Volcom did selling itself to Kering (then PPR) both in terms of the price they achieved and their timing. The deal happened almost four years ago.

Following the acquisition, I chronicled (as best I could given the limited information Kering provided on the separate performance of Volcom and Electric) what I’d call some apparent difficulties with integration and performance by the brands that I thought didn’t live up to Kering’s expectations given the price they paid ($607 million). It felt a little like Deckers’ purchase of Sanuk.

Read more

Deckers Has a Pretty Good Quarter. Sanuk, Not So Much.

The overall numbers for Deckers for the quarter look pretty good. But some of the comments left me a bit perplexed. Meanwhile, Sanuk is still not performing the way Deckers must have expected when they bought it.

Overall Results

In the quarter ended December 31, Deckers’ revenue rose 6.6% from $736 to $785 million. The gross profit margin rose from 51.1% to 52.9%. Part of the increase was due to their acquiring their German distributor. Net income was up 11.2% from $141 to $157 million. It would have been stronger, but revenue came in 3% below expectations.

CEO Angel Martinez explained the revenue miss in the conference call.

“As temperatures turned colder across the U.S. with the exception of the West Coast, which has remained unseasonably warm, demand for our weather collections spiked. We experienced strong gains in technical boots, fashion waterproof boots and boots with rain application. In total, sales of our weather offerings grew over 70%.”

“In many instances, demand for casual and weather boots [due to early cold weather] exceeded our inventory investments . As a result, we believe we missed nearly $7 million to $10 million in sales from domestic wholesale reorders as we were unable to fulfill 100% of the demand for these collections. We also believe that we missed approximately $2 million in online sales due to sellout of weather and casual boot product.”

“This shift to expanded categories has highlighted the need to further improve our ability to plan and manage our product and inventory strategy against these consumer purchasing trends. This also requires some adjustments in our product and marketing strategies at both wholesale and in our DTC channels, which we are currently implementing.”

This is a little confusing to me. If they were projecting revenues 3% higher, I would have expected them to have the required inventory on hand. But above he’s saying they missed $9-$12 million in revenue because they didn’t have inventory. Is that on top of the 3% miss?

At some level, this is a great problem to have as a CEO. Sure, we can all stand to work on improving our flexibility in getting the right product to the right market at the right time and to respond more quickly to changing market conditions. But I doubt either Mr. Martinez or any of Deckers’ other executives are going to get any better at predicting the weather.

Meanwhile, the gross margin rose and, as I’ve argued a bunch of times before, I bet a little scarcity wasn’t completely a bad thing for the brand. I might even connect some of the gross margin improvement with the scarcity. We do learn that, “…closeout sales decreased as a percentage of overall sales and had higher margins compared with the same period last year.”

But then he goes on and confuses me some more.

“Classics had a very good second quarter, both from a sell-in and sell-through perspective, which created some bullish expectations among our retailers and internally for the third quarter. This was the main driver behind our decision to raise guidance on our last earnings call. Unfortunately, most of November, with the exception of Black Friday and Cyber Monday weekend, was below plan, which we believe was a result of mild temperatures in certain markets and weak store traffic trends across the industry. Sales trends accelerated as the quarter progressed. However, it wasn’t enough to offset the slow start, which eventually led to some cancellations primarily in our domestic wholesale channels in December.”

You can, I think, see my confusion. On the one hand, Deckers missed some sales because of cold weather. On the other hand, they missed some because of warm weather. And all in the same quarter. I guess they are talking about different geographic markets and products, but a little clarity would be nice.

The UGG brand is branching out. You might check out their web site and note the UGG branded products under categories such as loungewear, handbags and home.

$402 million of the quarter’s revenue, or 51%, came from the UGG wholesale business. But that was up only half a percent from last year’s quarter. Total wholesale business for the quarter was $445 million, up from $441 million in last year’s quarter.

But revenues from ecommerce rose 25.2% from $117.3 to $146.9 million. And retail store revenue was up 8.3% from $178 to $193 million, though comparative store sales declined in the high single digits. They are working on improving store performance, but in the meantime have “…decided to moderate and assess the pace of new store openings.”  They ended the quarter with 138 stores worldwide.

Sanuk

Sanuk’s total revenue for the quarter came in at $20.5 million, down 7.9% from $22.2 million in last year’s quarter. Sales for nine months rose 6.7% to $75.4 million from $70.7 million in the same nine months last year. Happily for Deckers, Sanuk’s revenue represents just 2.26% of the quarter’s total.

Its wholesale revenue for the quarter fell 11.1%, from $19.97 to $17.76 million. For nine months, wholesale revenues have risen slightly from $64.4 to $66 million.

“Wholesale net sales of our Sanuk brand decreased primarily [for the quarter] due to a decrease in the weighted-average wholesale selling price per pair as well as a decrease in the volume of pairs sold.” Volume and price both down. Not so good.

Sanuk’s operating profit from wholesale revenues for the quarter fell from $1.085 million to a loss of $282,000. For the nine months period, it’s down 17.1% from $11.2 to $9.3 million.

The last piece of the earn out for Sanuk has to be paid by Deckers based on 2015 results and equals 40% of the total gross profit Sanuk earns in calendar year 2015. As of December 31, Deckers is estimating that amount to be $27.7 million. That’s down from $30 million at the end of March, 2014. If you knew what Sanuk’s gross profit was, you could pretty much calculate Sanuk’s projected sales this year, though that calculation is complicated by the fact that the estimated earn out is discounted at 7% to allow for the time value of money.

Oh hell, I can’t resist, but I’m going to ignore the 7% discount rate. If GP is Sanuk’s total projected gross profit for 2015, then .4 x GP = the earn out, or $27.7 million. Dividing both sides of the equation by 0.4, we see that total projected gross profit for Sanuk in 2015 is $69.25 million.

We know that Sanuk did $102 million in all of 2013. In nine months of fiscal 2015, it’s had revenue of $75 million (Deckers changed its fiscal year to March 31 last year).  In the first calendar quarter of 2014, Sanuk’s revenues were $30.7 million. If it did the same in this quarter, total Sanuk revenues for the fiscal year ending March 31, 2015 would be $105.7 million.

And just to finish up this little exercise in speculative financial analysis, if sales did come in at $105.7 million and gross profit were $69.25 million, the Sanuk gross margin would be 66%. Wow.

But how can that be with a $660,000 operating loss for the quarter on Sanuk’s wholesale business when ecommerce and brick and mortar sales of the brand total only $2.7 million? Perhaps the quarter isn’t indicative of business for the year.

Okay, I have got to stop this. But this is what happens when I get curious about something and there’s no information provided; I try to figure it out from what I’ve got.   See, the 10Q shows business segment assets for the Sanuk wholesale business of $208.8 million. The similar number for UGG wholesale is $334.9 million, or about 1.6 times Sanuk. But UGG’s wholesale revenues were 22.6 times greater than Sanuk’s during the quarter.

This is the best I can do with what I’ve got, but it doesn’t completely make sense to me. Perhaps some of you wise people out there can help me out?

Based on Sanuk’s performance since the acquisition, it’s pretty clear they overpaid for the brand and I wonder if that might have to be acknowledged by one of those noncash write downs of intangible assets.  We’ll see.

Anyway, Deckers has a strong balance sheet, they grew revenue and profit, and I’m intrigued by some of the brand extensions they are doing with UGG. We’ll see how that works out as we follow Sanuk.

Intrawest’s Quarter; Business as Usual. Mostly In a Good Way

You may recall that Intrawest got in an avalanche of unmanageable debt when the Great Recession took down the resort real estate market.  They solved the problems of an unpayable interest bill by getting their primary debt holder to convert a big chunk of its debt to equity and taking Intrawest public. I wrote about their predicament before they went public.

Intrawest, to refresh your memories, owns and operates Steamboat, Winter Park, Mont Tremblant, Stratton Mountain, Snowshoe and Blue Mountain. Let’s start with their income statement for the quarter ended December 31. This is prepared according to generally accepted accounting principles- just the way I like it. You can review the entire 10Q here if you want. Unless otherwise noted, all the numbers in this article are in thousands of U. S. dollars.

Read more

Quiksilver’s 2014 Results; Still a Work in Progress. Work Faster.

Quik filed their 10K last week, but the holidays kept me from any serious analysis until now. The best thing I heard in the conference call was CEO Andy Mooney saying, “The organizational restructuring of the company is now complete and the management team focused singularly on execution.”   We’ve learned, as we’ve watched other industry companies go through turnarounds, that cleaning up and getting organized is incredibly distracting from just running the business well.

I’m going to start with a summary of the financials. The first thing that jumped out at me was the year over year decline in stockholders’ equity from $388 to $58 million. That’s not an unexpected result given the loss for the year of $309 million, up from a loss of $233 million the prior year. Total liabilities, however, fell only 2.8% to $1.2 billion. Long term debt (net of current portion) declined 1.9% to $793 million.

The net loss includes a one-time gain of $30 million on the sale of Mervin Manufacturing and Hawk.

Obviously, no matter how you like to calculate it, the debt to equity ratio went through the roof compared to a year ago. I’ve written before about the need to get the turnaround producing positive cash flow and profits before the balance sheet deteriorated too much further. I’m still thinking the same thing, only with more urgency.

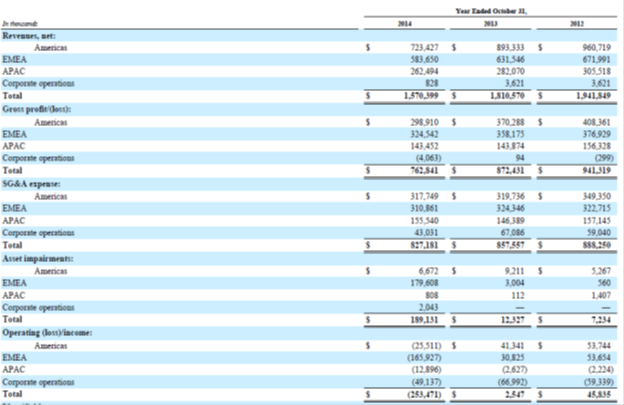
Sales declined from $1.81 to $1.57 billion (13.3%). There are some things you need to be aware of around goodwill impairments and licensing revenues. But first, here are the summary numbers according to GAAP straight from the 10K, which you can review here if you want.  The numbers are in millions of dollars.  Let’s run through these numbers and I’ll add a little “color,” as they say in earnings conference calls.
quik from 2014 10k 1-15


As you see above, revenues fell in all three regions. EMEA is Europe; APAC is Australia and the Pacific. The gross profit margin (not in the table) in the Americas declined from 41.5% to 41.3%. In EMEA it was down from 56.7% to 55.6%. In APAC, it rose from 51% to 54.6%. Overall, the gross margin rose from 48.2% to 48.6%. The increase “…was primarily due to the segment and channel net revenue shifts toward our higher margin EMEA and APAC segments, and retail and e-commerce channels versus our Americas segment and wholesale channel.” Gross margin dollars, you will note, were down in all three segments, though only very slightly in APAC.

You may recall that Quik is being selectively more aggressive on pricing, particularly on board shorts. If, while doing that, they can still improve their gross margin, it suggests that other parts of their program must be having some success. The caveat is that I don’t know the extent or breadth of those price reductions.

Sales in the U.S. represented 35% of Quik’s total sales, down from 38% a year ago.  Total U.S. sales, according to my careful calculations, fell 20% from $688 million to $550 million. Wow. The wholesale segment in the U.S. seems to suck for Quik. Not just for Quik.

Worldwide, wholesale business fell from 71% to 67% of the total. Brick and mortar rose from 25% to 28% and ecommerce was up from 4% to 5%. Quik ended the year with 683 company owned stores worldwide including 147 factory outlets. 100 stores are in the Americas. EMEA and APAC have 296 and 287 stores respectively. Those numbers do not include 252 stores “…licensed to independent third parties in various countries.”

I’d be curious about the financial model for those licensed stores. Does Quik get a fee for the licensed name and then sell them product at the same prices as to other independent retailers? Are they involved in merchandising? Anybody want to put a comment on my web site about how that works? You might as well as long as you’re hear reading this anyway.

Quiksilver brand revenue fell 12.9% ($93 million) from $721 to $628 million. $17 million of the decline was due to “Our licensing of peripheral product categories…”

Roxy fell 6% from $511 to $480 million. No impact from licensing for Roxy.

DC revenues were down 21%, falling from $542 to $427 million. $10 million of the decline was due to licensing. We learn in the conference call that additional categories may be licensed in the future.

I have no doubt that licensing the peripheral product categories is a good financial decision. But not long after it happened, I walked into my local Fred Meyers for my groceries and saw in their ad, “Quiksilver Kids- 25% off!”  Anyway, I worked my way to the clothing section and there in fact was the Quik and DC kids merchandise with a big sale sign on it.

So, I know it’s just the kid stuff, and I know it was a good financial decision, and I know I lack objectivity about this. But, damn it, it’s still representing the Quiksilver brand and I hated seeing it there and I hated the thoughtlessness with which it was merchandised and I hated what it was surrounded by. Okay, they needed to do it, and it was somehow the “right” decision and all that and it still depresses me to think about it.

Let’s move on.

Take a look at the SG&A expenses in the chart. The biggest reduction was in corporate operations ($24 million of the total reduction of about $30 million). Actually, I guess that’s what you’d want to see- spend the money in the places that can drive sales and profits. That’s generally not the corporate offices.

As a percentage of sales, however, SG&A expense rose from 47.4% to 52.7%. Obviously, that can’t continue. They note in risk factors that “We may be unable to continue to reduce SG&A at the same pace.” No kidding. I suspect Quik isn’t finished taking costs out of their supply and logistics chain, but SG&A can’t go down forever.

Promotion and advertising expenses totaled $78 million for the year. In the two prior years, they were $93 and $118 million respectively.

Now we get to the asset impairment charge of $180 million in EMEA. Yes, it’s noncash. Yes, it’s “one time,” though there always seems to be a new one charge time in the following year (Not just talking about Quik). No, that doesn’t mean you can ignore it. It is an indication of a real decline in future cash flows and the value of those assets.

Finally, at the operating income line, we see worse performance and a loss in all three segments compared to the previous year. Just for fun, let’s take out the asset impairment charge in EMEA. If we did that, we’d see the operating profit of EMEA was $13.7 million; positive, but down from the previous year.

Okay, almost made it to strategy. Just a few more financial comments.

The allowance for doubtful accounts has increased from $57.6 million at the end of fiscal 2012 to $60.9 million at fiscal 2013 end and $64 million 2014 fiscal year end. This has happened while sales fell 20%. Not necessarily supposed to work that way.

Also looking at the balance sheet, the current ratio has fallen from 2.49 to 2.13, but that’s still okay. Trade receivables were down 22.4%- more than the decline in sales. The same is true with inventories. They were reduced by 22.3%. They reduced the average day’s sales outstanding by four days to 93 and inventory days on hand from 122 to 118. Good work. I will not be surprised to see further improvement in the inventory numbers.

Interest expense was $76 million, up from $71 million last year and $61 million the year before that. Most of their long term debt is fixed rate, but the rates are between 7.8% and 10%. The first maturity of this debt is December of 2017.

Quik’s three fundamental strategies are “1) strengthening our brands; 2) growing sales; and 3) driving operational efficiencies.”

Nothing surprising there. I’m guessing every company would like to do that. You can read the details on page one of the 10-K. I see some progress in numbers one and three. Obviously, given the financial results, we aren’t there on number two yet. However, CEO Mooney tells us, ”Looking at the year ahead, we are pleased with our order book for spring ‘15 as it represents the stabilization of the business beginning in Q2 providing a foundation for significant EBITDA growth in 2015 with top line and incremental EBITDA growth coming in 2016 and beyond.”

Basically, he’s calling the bottom. And none too soon I’d say given the balance sheet. CEO Mooney projects a 2015 revenue increase “…in the low single digit range normalized for categories transitioning to a licensed business model.” They expect “proforma adjusted EBITDA” (whatever that means) to be $80 to $90 million assuming current exchange rates. Nobody is projecting a profit, though they expect positive free cash flow in 2015.

They make this statement in the 10-K:

“We believe that the integrity and success of our brands is dependent, in part, upon our careful selection of appropriate retailers to support our brands in the wholesale sales channel. A foundation of our business is the distribution of our products through surf shops, skateboard shops, snowboard shops, sporting goods stores, and our own proprietary retail concept stores, where the environment communicates our brand and culture. Our distribution channels serve as a base of legitimacy and long-term loyalty for our brands. “

You won’t be surprised I agree with that statement though, bluntly, I don’t quite see Quiksilver as having completely taken that approach since Andy Mooney became CEO.  But I’m partly willing to give them a pass because of the turnaround they had to engineer and are still engineering. There are some comments in the conference call about a being less promotional on their web site to support the core business and you’re aware they pulled DC back in distribution partly to address these issues.

With regards to marketing, Andy notes, “On marketing we went a little bit darker [in] marketing candidly in the transition, but we will come back with the vengeance in the spring as we said 40% increase in media. That media will be spent almost solely in core skate, surf and snow magazines in both print and vertical specifically to drive that business in the key markets of North America, Europe and Australasia. We are also going to increase our marketing spending in terms of point-of-sale presentations within the core surfer retail accounts reinvesting in grassroots and activating marketing the athletes that are important to those accounts and the consumers who shop in those accounts…”

That seems like a step in the right direction.

Given where they’ve come from, I really don’t dispute most of the operational steps Quik has taken. I haven’t liked seeing them all, but I understand them. I’m guessing we’re mostly though with SG&A reductions, though I’m thinking there might be some more improvement in gross margin through more inventory and supplier rationalization. For me, it’s right now about timely sales increases that improve cash flow to manage, and ultimately improve, the balance sheet.  We seem to have arrived back to where public companies in this industry always get- can you build strong brands while growing revenue enough to make wall street happy?

Abercrombie & Fitch’s Quarter: Now You See Him, Now You Don’t

When CEO Michael Jeffries is on the conference call on December 3rd, then “retires” on December 8th, you kind of figure out there are issues. The 10-Q can be viewed here. On page 24 you can read some of the details of his retirement, though not the reason for it. The recent financial performance of the company probably has something to do with that.

As always, I’ll get to the financial details. But let’s start at the 10,000 foot level and hear how Abercrombie & Fitch (A&F from now on) describes their market positioning on page 24 of the 10-Q. The quote is a bit long, but I’d like you to read it carefully and see how it feels given what you think about our market.

“The modern Abercrombie & Fitch is the next generation of effortless All-American style. The essence of laidback sophistication with an element of simplicity, A&F sets the standard for great taste. From classic campus experiences to collecting moments while traveling, A&F brings stories of adventure and discovery to life. Confident and engaging, the Abercrombie & Fitch legacy is rooted in a heritage of quality craftsmanship and focused on a future of creative ambition. abercrombie kids is the next generation of All-American cool. The essence of fun and friendship, a&f kids celebrates each moment by sharing its effortless great taste with the world. From documenting school spirit days and team sports to

traveling abroad and experiencing new cultures, a&f kids tells stories filled with youthful excitement and a touch of mischief. Confident and independent, abercrombie kids stands for quality, on-trend style, and creative imagination. Each day brings a new discovery, a chance for adventure, and the opportunity to make history. Hollister is the fantasy of Southern California. Inspired by beautiful beaches, open blue skies, and sunshine, Hollister lives the dream of an endless summer. Spontaneous, with a bit of edge and a sense of humor, it never takes itself too seriously. Hollister’s laidback lifestyle is naturally infused with authentic surf and skate culture, making every design effortlessly cool and totally accessible. Hollister brings Southern California to the world.”

I am not saying that’s not a valid market position and maybe that’s truly what they are aiming for. But it doesn’t feel like the customer group I associate with our target market in action sports, youth culture, outdoor or whatever we’ve become. There certainly ain’t no “authentic surf and skate culture” there.

I hate to say this, but there are a few things in that positioning statement that appeal to me and my generation (boomer). You probably already know how incredibly uncool I am. I only buy new clothes when my wife starts to hem and haw when she sees what I’m wearing. Sometimes, in desperation, she throws out pieces I’ve got and hopes I won’t notice. I think the lapel width on the emergency suit I own is back in style again, but I’m not sure.

Fundamentally, then, this is their strategic problem. For lack of a better word, A&F is preppie. That’s where their roots are. But that’s a shrinking market if only because those customers are aging. Growth, then, requires some new customers. How do you change your positioning to attract those new customers without alienating the old ones?

It’s not a new or unique problem, but it’s a hard thing to do. They seem to recognize this. I think it’s related when they note as a risk factor that,”Our inability to transition to a brand-based organizational model in a timely fashion could have a negative impact on our business.” I’d add that transitioning could have at least a temporary negative impact.

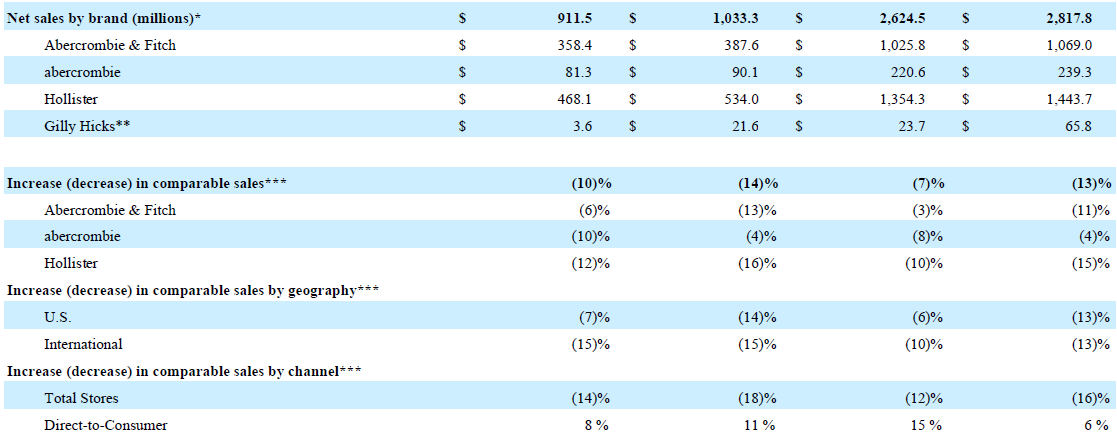
Sales for the quarter ended November 1st fell 11.8% compared to last year’s quarter from $1.033 billion to $911.5 million.

Sales in the United States fell 11.9% to $595 million. Europe was down 18.2% to $223 million. Other rose 9.2%, but only to $94.1 million, representing 10% of the quarter’s total revenue. Direct to consumer rose 7.4% from $174.6 to $187.5 million.

This is probably a good time to remind everybody that the strengthening dollar, a trend I see continuing, is going to cause revenues translated from other currencies to decline. It reduced A&F’s sales for the quarter by $8 million. I hope that’s the worst it causes.

Below I’ve pulled out of A&F’s 10-Q the changes by brand and for comparable sales during both the quarter and the first nine months of the fiscal year. I think the numbers speak for themselves from a revenue perspective. They expect fourth quarter revenues to be down “…by a mid-to-high single-digit percentage.”

A&F 11-1 10q 12-14

A&F11-110-Q12-14


The company ended the quarter with 1,000 stores, down from 1,049 a year ago. They expect to close a total of 60 this year, and a similar number in each of the next several years.

The gross profit margin fell from 63.0% to 62.2%. They describe the decline as “…primarily driven by increased promotional activity.” Store and distribution expense fell 13.9% from $481 to $414 million. It fell as a percentage of sales from 46.4% to 45.4% even with the decline in sales. That’s good work.

There’s also a 17.2% decline in marketing, general and administrative expenses from $126.7 to $105 million. It also fell as a percentage of sales from 12.3% to 11.5%. Again, good work. They characterize the decline as the result of decreased compensation expense offset by an increase in marketing expense.

Okay, now we have to get to the part where in last year’s quarter, they had restructuring and asset impairment charges totaling $88.3 million. In this year’s quarter, they “only” reported charges of $16.7 million. That’s a $71.6 million difference. In addition, they had other operating income in last year’s quarter of $9.9 million. In this year’s quarter, it was $1.5 million.

As you can imagine, this resulted in quite a change in operating income. In last year’s quarter it was a loss of $35.4 million. This year, it was a gain of $33.4 million. That is quarter over quarter improvement, but with huge impact from the various charges. If you eliminate all those charges and the other income in both quarters, you find their operating income rose from $43.1 to $48.5 million.

As you know, I don’t take at face value any management’s cry that “It’s a one-time charge” or “It’s noncash!” and the implicit suggestion that I just ignore them. The need to take those charges tell you something about the future of the business and its cash flow. That doesn’t mean you shouldn’t be aware of the difficulties those charges cause in interpreting the financial statements.

Interest expense rose from $1.7 to $5.6 million. Net income for the quarter improved from a loss of $15.6 million to a profit of $18.2 million. However in last year’s quarter they had a tax benefit of $21.4 million compared to a tax expense of $9.6 million this year.

On the balance sheet, the current ratio is mostly unchanged, hovering around 2.2. Long term debt to equity has risen from 0.34 to 0.48. Inventory has fallen consistent with the sales decline (down 20%), but cash is up. However, long term debt has risen from $123.7 to $292 million, explaining the increase in interest expense. Total equity has fallen from $1.68 to $1.4 billion. If you want to argue the balance sheet is a bit weaker than a year ago, I guess you can, but there is no fundamental problem here. In last year’s nine months, cash used in operations was $230 million. This year, it’s been a positive $29 million.

Last thing on the financials; the 10-Q included a review by PricewaterhouseCoopers, their independent public accountant. You don’t normally see that in a 10-Q. I think it’s due to the fact that the company had some accounting issues that, while not significant in their overall scheme of things, requires the restatement of prior year financials. Not a good thing to have happen when the company is having issues as it calls your other numbers into question at the worst possible time.

CEO Jeffries summarizes the changes they are making this way in the conference call.

“These changes include; first, shifting to a branded organization; second, making major changes in our assortments including faster speed-to-market and lower AUC; third, engaging how we — changing how we engage with our customer; fourth, introducing new store designs; fifth, aggressively investing in DTC and omni-channel; sixth, closing domestic stores; and seventh, taking well in excess of $200 million of expense out of our model.”

Shades of PacSun. Closing bunches of stores over a period of years and changing their market positioning. The difference is that PacSun had lost their market position and needed to get one back. A&F has one, but needs to change it. Their balance sheet better positions them to accomplish the task and the reduction in expenses over the last year is good progress.

But damn, it’s a hell of a challenge when the evolution of your target customer is involved.

The Buckle’s November 1st Quarter; Little Financial Change

For the quarter ended November 1, 2014, The Buckle’s revenues rose a little from $286.8 to $292.2 million. That’s a 1.9% increase over last year’s quarter.

The gross profit margin fell a little from 44% in last year’s quarter to 43.7%. In dollars it went up a little from $126.2 to $127.8 million.

Selling, General and Administrative expenses rose a little (1.7%) to $63.2 million. As a percentage of sales, selling expense stayed the same at 18.1% and general and administrative expense fell a little from 3.6% to 3.5%.

Operating income rose- you guessed it- a little, from $64.1 to $64.6 million.

Net income was up a really, really, really little (0.079%, or $32,000) to $40.6 million.

Well, these day holding your own isn’t the worst result we’re seeing among retailers in our industry.

The balance sheet is in good shape, with comparable store inventory down about 1.5% compared to a year ago. Net cash flow from operations was a positive $69.3 million in the three quarters of last fiscal year. It improved to $90.6 million this year. That’s more than a little. I like positive cash flow.

The company ended the quarter with 461 stores in 44 states, up from 452 stores in 42 states a year ago. So far this year, they’ve opened a net of 11 new stores and did what they call “substantial remodels” on 17. According to the conference call, plans presently call for 6 new stores next year and 10 of those substantial remodels. I’d love to hear something about the impact of the remodelings.

Comparable store sales were down 0.3% during the quarter. Online sales are not included in comparable store sales. They rose 3.7% during the quarter to $22.8 million compared to $22.0 million in last year’s quarter.

The conference call is short and not particularly intriguing either. Private label business, we hear, was 35% of revenues, the same as in last year’s quarter.

One analyst asked President and CEO Dennis Nelson “…about your philosophy on ecommerce versus stores.” I’d characterize his answer as noncommittal and understated.

“Well, we continue to look at new marketing and upgrading our staff and taking different approaches, so it is something we are not ignoring. We involve the merchandise teams continually more on that, so we would expect it to continue to have steady growth, and we have taken approach that it’s part of our business.”

While that isn’t the whole answer, you get the gist. Compare that to the soliloquy we’d get from Zumiez’s senior management in response to the same question. I’m not highlighting this as a problem. I doubt CEO Nelson’s answer encompasses his complete thinking about ecommerce. I hope not. But I do wish somebody had followed up and used the word “omnichannel” to see what response we’d gotten.

And that’s about it. I’d like to thank The Buckle for making this one easy for me, though I wouldn’t have minded a bit more information.