Nobody Wants to Talk About Sanuk, But Deckers Has an Outstanding Quarter

That’s not quite true.  I want to talk about Sanuk, though probably for the last time.  There’s not a mention of the once high-flying brand in the conference call, and it only comes up in the 10-Q because, inconveniently I imagine, they have to acknowledge its existence.

For the quarter ended September Sanuk revenue was down 9.4% ($1.43 million) from $15.22 million in last year’s quarter to $13.80 in this year’s.  The Sanuk wholesale business had an operating profit of $291,000 down from $1.23 million in last year’s quarter, a drop of 76.3%.  Add any reasonable allocation of overhead, taxes, interest and the brand lost money during the quarter.

Read more

Ho Hum- Another Strong Quarter for VF. And a Few Thing to Make You Think

It’s not my purpose to simply report earnings.  That’s why you don’t see an article every time an industry public company reports.  By waiting for the actual publicly filed document, I hope to glean a few pieces of information that might make you think-bring you up short even- and perhaps help you run your business better.

VF has had a string of glowingly good reports and the one for the quarter ended September 30 is no exception.  I’ll get to summarizing the numbers, but first here are some other things for you to consider.

Back in September, VF held a Vans investor day where they announced they were planning to take Van’s revenues from $3 to $5 billion in five years.  I wrote this article looking at why they might, or might not, pull it off.  I said, “Vans is well into an experiment to see if a truly “omnichannel” approach to branding and customer engagement change some of the rules for growing a brand.”  They are betting they can outperform by doing the things all brands/retailers need to do but doing them better than their competitors.

What ever happened to “features and benefits” as the preferred way to differentiate products?

A year ago, a friend recommended Retail’s Seismic Shift, by Michael Dart, to me.  It finally got to the top of my reading stack.  Should have gotten there sooner.  In the last chapter is an interview with former VF CEO Eric Wiseman.  Good read.

Brand Extension Versus Distribution Management

One of the things we do in the new retail environment, and that VF thinks it can do better than most, is to be insightful about where we get sales growth.  Too much growth in the wrong places, as it always has, equals brand damage.  I’ve been making that speech for at least a decade, but it’s become more important as the consumer has become more knowledgeable, perhaps less brand loyal, able to find information easily and buy in multiple places.

In talking about Vans in Europe, CFO Scott Roe says, “It’s really about making sure that we don’t get over torqued in any one particular part of our business.  And what we’re seeing there is some rationing, frankly, of some of the product as we ensure that not one style or not one category gets too much out of balance.”

And then, addressing The North Face, CEO Steve Rendle makes the comment, “I think the brand is absolutely anchored in that core Mountain Sports… Where we’ve seen really nice growth…is more of that Mountain Lifestyle component, the more contemporary logo-ed sportswear pieces that are taking their influence from the Mountain Sports category, the influence that, that’s having on Urban Exploration component of the line.”

“And what we’ve seen in Europe is a brand that’s moved beyond just an outerwear and equipment resource, but truly a brand that can deliver lifestyle apparel while being very anchored in that outdoor Mountain Sports category. And that’s exactly what you see taking place in Asia. More importantly, what we just saw this quarter here in the United States marketplace, where we saw a strong sell-through of daypacks, really good lifestyle sportswear logo.”

Talking about the Williamson-Dickie acquisition he notes, “We knew that it was a strong consumer-focused brand…But what we’re finding is that it’s anchored so well in the Work category, specifically here in the U.S., but as we’ve worked with management and begun to understand the consumer response to this brand, we’re seeing a much stronger work lifestyle component anchored in Asia and Europe that we see being able to bring back across the globe.”

CFO Rendle suggests in the conference call that they feel Timberland has the same potential as Vans, The North Face and Williamson-Dickie to maintain its core business but expand outside it.

Controlled distribution in a brand’s existing franchise to protect the brand’s credibility but look for growth in tangential areas for growth where it’s already accepted but the opportunity hasn’t really been exploited.  This, I’m pretty sure, is a key criterion for VF’s evaluation of brands- both those that they buy and those that they sell.

Speaking of Buy and Selling

It’s not exactly a sale, but VF is spinning off their jeans business as a separate public company.  Here’s what I wrote about the August announcement.

On October 2, 2017 VF acquired Williamson-Dickie for $800.7 million.  It generated $252.8 million of revenue and $18.5 million of new income in the September 30 quarter.

On April 3, 2018, VF acquired Icebreaker for $198.5 million. It contributed $53.7 million in revenue and $7.0 million in net income during the quarter.

June 1, 2018 brought the acquisition of athletic and performance-based lifestyle footwear brand Icon-Altra for $131.7 million.  During the recent quarter its revenue and net income contributions were $17.0 and $1.9 million respectively.

On April 30, 2018, VF sold the Nautica brand for $289.1 million and recorded a loss of $38.6 million.

VF sold its License Sports Group and the JanSport brand collegiate businesses on April 28, 2017, receiving net proceeds of $213.5 million and reporting a loss of $4.1 million.

And in October 2018 VF sold Reef.  Finally, after all my years bemoaning that we got no indication of how Reef was doing, we get a few numbers as a going away present.  Subject to some adjustments, the proceeds from the sale were $139.4 million.  The expected loss $9.9 million.  Reef’s revenues, we’re told in the conference call were around $150 million annually.

They’ve also sold the Van Moer business they got with Williamson-Dickie, but the numbers are very small.

VF has always characterized itself as a portfolio manager.   I hypothesize that VF has stood up, sniffed and wind, and taken notice of the massive changes happening in brand and retail management.  No kidding, right?  Haven’t we all.  Many retailers and brands, however, seem flummoxed bordering on paralyzed by the change.  Or it’s just too late for them.

VF, on the contrary has looked at it’s size, it’s diversified portfolio, management discipline and processes, manufacturing and supply chain flexibility, solid financial condition and strength as a portfolio manager and seen an opportunity rather than a problem.

Over the years, we’ve watched lots of brand try and fail at extending their brand franchise into other distribution and new customer groups.  This has been especially prevalent in public companies because of the pressure to increase revenues.

VF is very specifically restructuring its portfolio of brands to take advantage of the new competitive conditions in ways it believes many of its competitors can’t or won’t.  Brands they acquire (and keep) will have the virtues they describe in talking about Vans, The North Face and Williamson-Dickie in the quotes above and will be positioned to benefit from the resources VF brings to the table.  The jeans business they are spinning off is an excellent example of a business that doesn’t fit VF’s criteria.

Think about that while we move on to the numbers for the quarter.

Financial Results

Revenues as reported rose 15.2% from $3.39 billion in last year’s quarter to $3.91 billion in this year’s.  The breakdown by channel and segment is shows below for this year’s and last year’s quarter.


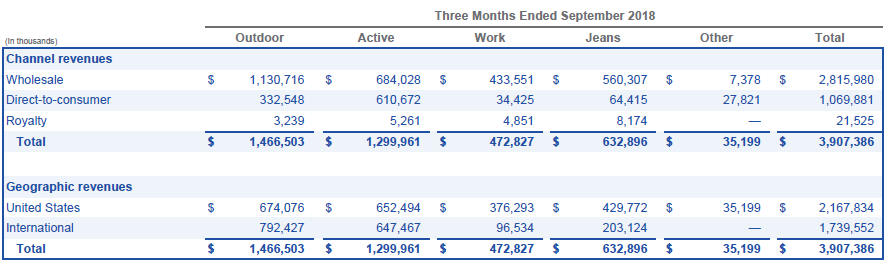
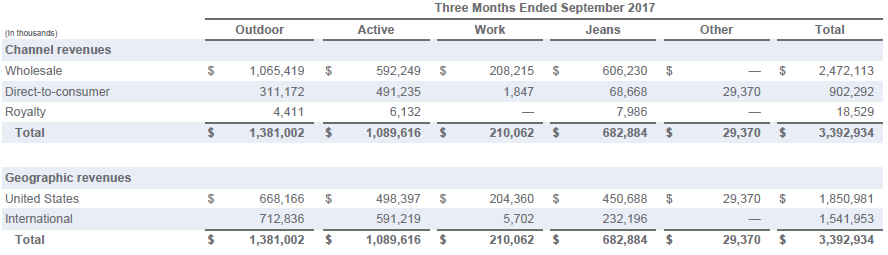
Outdoor includes The North Face, Timberland, Smartwool, Icebreaker and Altra.  The big dog in the Active segment is Vans.  It also includes six smaller brands.  Of those six, JanSport and Reef are now sold.  Remember that Jeans is being spun off.  The next chart shows revenue and operating profit by revenue by segment for the two quarters.  It’s a little easier to compare the change in revenues than in the chart above.


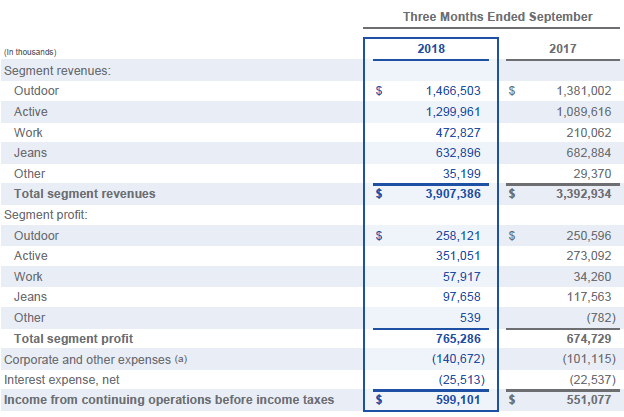
Of the revenue growth of $515 million quarter over quarter $230.9 million was from organic growth and $323.5 million from acquisitions.  Vans revenues rose 26% and The North Face 5%.  Timberland revenue fell by 2%.  Wrangler and Lee were down 5% and 9% respectively, in case anybody was wondering why they are being spun off.

The gross margin declined very slightly from 50.2% to 50.1%.  “Gross margin in the three months ended September 2018 was negatively impacted by lower margins attributable to acquired businesses, acquisition and integration costs and certain increases in product costs, partially offset by a mix-shift to higher margin businesses and increases in pricing.”

SG&A expense was up 15.1% from $1.13 to $1.30 billion.  As a percent of total revenue they declined from 33.3% to 33.2%.  “The decrease…was due to leverage of operating expenses on higher revenues and was partially offset by expenses related to the acquisition, integration and separation of businesses and continued investments in strategic priorities.”

Net interest expense rose $3.0 million in the quarter “…due to higher levels of short-term borrowings at higher interest rates and lower interest income as compared to 2017, which was partially offset by lower interest on long-term debt due to the payoff of the $250.0 million of 5.95% fixed-rate notes on November 1, 2017.”

Operating income grew 14.4% from $575.5 to 658.7 million.  Net income rose 31.4% from $386.1 to $507.1 million.

The balance sheet remains strong with no significant changes not explained by acquisitions and divestitures.  Cash provided by operating activities fell from $217 to $103 million.

We went through a phase years (decades?) ago where I pronounced, correctly I think, that operating well was a competitive advantage because so few were doing it.  As industry management sophistication increased (more or less) I decided that operating well had become just a requirement of getting a chance to compete offering no competitive advantage- companies that had survived were mostly operating well.  Now VF, as well as a few other companies, believes they can make operating well- keeping up with a relentless pace of change- a competitive advantage again.

In Touch with Reality? Big 5 Sporting Goods Quarter

For its September 30 quarter, 436 store Big 5 reported a small decline in revenue and a larger decline in net income.  More significant to me are comments in the conference call that suggest a very traditional retail focus, rather than one acknowledging the massive changes required to succeed at retail.

Revenue in the quarter fell 1.5% from $270.5 million in last year’s quarter to $266.4 million in this year’s.  54.8% of the quarter’s revenue was from hard goods.  Apparel was 16.9% and footwear 27.8%.  A 2% decline in comparable store sales was the major reason for the revenue decline.  I want to highlight the following comment from the 10-Q as part of the revenue discussion:

“Sales from e-commerce in the third quarter of fiscal 2018 and 2017 were not material and had an insignificant effect on the percentage change in same store sales for the periods reported.”  You might also want to look at their web site.

It’s 2018 and a 436-store retailer has e-commerce revenues that are “not material?”  Hmmmm.  Wonder how much e-commerce related expense it takes to produce “not material” revenues.

The gross margin fell from 32.4% to $31.0%.  Revenue reduction was the biggest cause of the decline.  Second was higher distribution expense of 0.73% including increases freight costs.  Lot of that going on.  Store occupancy costs accounted for 0.42% “…due primarily to lease renewals for existing stores.”

Finally, there was 0.10 decline in merchandise margins.

SG&A expense rose a couple of hundred thousand to $77.7 million.  As a percent of revenue, they rose from 28.6% in last year’s quarter to 29.2% in this year’s.  Minimum wage increases, especially in California where more than half of their stores are located, caused a $400,000 increase with more coming.

Operating income was down 52.7% from $10.2 to $4.8 million.

Interest expense rose from $447,000 to $860,000 reflecting both higher debt levels and an interest rate that rose 1%.  That’s happening to many companies.

Income taxes fell from $3.79 million to $844,000 “…primarily reflecting a reduction in the federal corporate income tax rate…”  The decline in net income was 47.7% from $5.95 million in last year’s quarter to $3.12 million in this year.  Consider how much more net income would have fallen if not for the reduced income taxes.

Net cash used in operations for the six months ended September 30 was $8.06 million, up from $5.55 million in the same six months last year.  You’d rather see cash generated by operations rather than used.

On the balance sheet cash, at $5 million is down about $300,000 from a year ago.  Inventory has risen from $309.3 to $314.8 million.  They note they are carrying over some inventory to next year- a common practice these days (but also indicative of a lack of product differentiation in the industry).  The current ratio has improved from 2.07 to 2.36 times.  Long term debt is up from $46.4 million a year ago to $83.5 million at the end of this year’s quarter.  Equity has fallen by 11.3% from $203 to $181 million.

The quarterly dividend has been reduced from $0.15 to $0.05, reflecting the weaker financial position and operating results.

Let’s move to the conference call.  On the positive side, Chairman, President and CEO Steve Miller says, “With our new POS system now in place, we are expanding our customer relationship management capabilities, which should provide enhanced customer analytics and improve the effectiveness of our marketing efforts.”

Collecting, slicing and dicing, and making better use of customer data is something every retailer has to be figuring out how to do better.  They also are increasing their digital advertising spend at the expense of newspaper advertising.

But other comments seem traditional.  There’s a generic statement about the change happening in retail, but what I hear in their comments is a tactical urgency to deal with the current financial situation (not inappropriate) rather than a strategic acknowledgement that a lot has to change- quickly.

“We are testing pricing strategies to be more responsive to an increasingly promotional competitive retail environment.” He mentions that again in part of his response to an analyst’s question.

Well, okay, but if you’re planning to compete on price with brands lots of others carry with your current real estate model in an environment of over supply and limited product differentiation, you might have a hard time.  No brick and mortar pricing strategy is likely to win in an online world unless the product offerings are distinctive in ways that probably have to go beyond the actual product attributes.

“From a product standpoint, we are accelerating the pace of change within our assortment. This includes downsizing certain product categories to position us to be more aggressive in pursuing product opportunities that we believe have higher growth potential.”

Again, fine, but tactical.  Have you acknowledged the fact that brands are going to turn over faster?  How are you identifying and bringing in new brands and what’s the process for getting them in the right stores?  How’s the micro sorting going?

There are a couple of mentions of finding new ways to reduce expenses.  That’s great, but of course there’s a limit to it and as they describe it, it sounds tactical.  Successful retailers won’t be the ones that reduce expenses; they will be the ones that increase expenses in a way that improves margins, provides a better customer experience, and ties brick and mortar and online together in a way that ultimately reduces costs.

It’s hard to know too much about what’s going on from what they say in a conference call, but I work with what they give me.  I suggest you visit a Big 5 store then perhaps a Dicks and see what you think.  I’d like to see more sense of urgency from Big 5.  An acknowledgement of the interdependence of brick and mortar and online as a means of providing customers with the flexibility and connection they require would make me feel a whole lot better too.

Somebody Wants to Buy Amer Sports

Back on September 11, due to some speculation in the media, Amer Sports confirmed that it had “…received a non-binding preliminary indication of interest…from a consortium comprising ANTA Sports Products Limited and the Asian private equity firm FountainVest Partners…” to buy all of Amer Sports’ shares at a cash price of forty Euros per share.

Here’s a link to the Amer Sports web site.  The brands the company owns include, among others, Salomon, Arc’teryx, Armada and Atomic.

ANTA describes itself as follows:

“Established in 1994 and listed on the Main Board of Hong Kong Stock Exchange in 2007, ANTA Sports Products Limited (stock code: 2020.HK) is the leading sportswear companies in China. Up to Nov. 2016,ANTA’s market value was summed up to USD 7.39 Billion.”

“For many years, we have been principally engaged in the design, development, manufacturing and marketing of ANTA sportswear series to provide professional sporting goods to the mass market.”

“In recent years, we have started moving full steam ahead with the strategy of “Single-focus, Multi-brand, and Omni-channel” to deepen our footprint in the sportswear market.”

The ANTA web site can be found here.   They are a public Chinese company with reported 2017 revenue of 16.7 billion renminbi (about US$ 2.4 billion at the current exchange rate).

ANTA’s purchasing partner FountainVest “…FountainVest is a leading private equity firm investing in companies that benefit from China’s growth, now managing total assets over US$4.5 billion…Our investment strategy has consistently focused on businesses that benefit from the secular growing needs and rising aspirations of the expanding Chinese middle class. While we are a generalist fund that invests across sectors, we have strong experience in areas of healthcare, consumer retail, media & entertainment and lifestyle. Our deal types are both control and growth capital oriented, with us having a high operational focus and a dedicated portfolio management team.”

And here is their web site if you want more information.

On October 11 Amer Sports, by press release, confirmed that there have been discussions between Amer Sports and the potential buyer “…to ascertain whether there is a basis to commence a more formal process to facilitate a possible recommended transaction.”  You can find the press releases here if you’re interested.

We are a long way from a deal, but they’re talking.  As of the end of June, Amer Sports had 116,517,285 shares outstanding.  The stock price closed at 33.89 Euros on October 12.  A purchase price of 40 Euros would represent a premium of 18% and an enterprises value of 4.66 billion Euros.    The stock price has risen from around 29 Euros since the September 11 announcement, with most of the increase coming at the time of the announcement.  It will get closer to 40 Euros if the market comes to believes a deal is more likely to happen.

A quick look at ANTA’s balance sheet leads me to believe they don’t have the financial capacity to pull off the deal alone, hence the involvement of FountainVest.

I don’t have any staggering insights on this transaction, but I hadn’t seen it mentioned and thought you’d be interested in knowing about it.  We are in an industry where it’s good to be big.

Hibbett Sports, Inc: “At the end of the second quarter of Fiscal 2018, we successfully launched our e-commerce website.” Wait- What? That Can’t Be Right.

From time to time, just for fun, I review public filings of companies I haven’t written about.  Hibbett Sports, with 1059 stores in 35 states at the end of their August 4th quarter, is one of those companies.  The quote in the title got my attention, to put it mildly.

It’s not quite as bad as it sounds, because their fiscal 2018 2nd quarter was a year ago.  Here’s a link to their web site.   Everybody, even Hibbett management, will concede they are way behind the internet/e-commerce/omnichannel curve.  How might this have happened and what are they doing about it?

Here’s how they describe themselves.

Hibbett Sports, Inc. is a leading athletic-inspired fashion retailer primarily located in small and mid-sized communities across the country. Founded in 1945, Hibbett stores have a history of convenient locations, personalized customer service and access to apparel, equipment and coveted footwear from top brands like Nike, Under Armour and Adidas…As of August 4, 2018, we operated a total of 1,059 retail stores in 35 states…

The Hibbett Sports store is our primary retail format and is an approximately 5,000 square foot store located primarily in strip centers which are usually near a major chain retailer such as a Wal-Mart store. Our Hibbett Sports store base consisted of 820 stores located in strip centers, 27 free-standing stores and 212 enclosed mall locations as of August 4, 2018.

Our primary strategy is to provide underserved markets a broad assortment of quality brand name footwear, apparel, accessories and athletic equipment at competitive prices in a conveniently located full-service environment. At the end of the second quarter of Fiscal 2018, we successfully launched our ecommerce website. We will continue to grow our online business aggressively, while continuing to enhance our stores to improve the overall customer experience. We believe that the breadth and depth of our brand name merchandise consistently exceeds the product selection carried by most of our competitors, particularly in our smaller markets. Many of these brand name products are highly technical and require expert sales assistance. We continuously educate our sales staff on new products and trends through coordinated efforts with our vendors.

There are a few phrases in that lengthy quote I’ll come back to.

  • “…located in small and mid-sized communities…”
  • “…provide underserved markets a broad assortment of quality brand name footwear, apparel, accessories and athletic equipment at competitive prices in a conveniently located full-service environment.”
  • “…the breadth and depth of our brand name merchandise consistently exceeds the product selection carried by most of our competitors, particularly in our smaller markets”
  • “Many of these brand name products are highly technical and require expert sales assistance…”

First, let’s look at their numbers to provide an introduction to Hibbett.  Below is a chart from their most recent 10-K that gives summary income statement numbers for the last three years.


The most recent fiscal year ended February 2, 2018.  As you see, sales and comparable store sales haven’t performed well, and net income is down a bunch.  Note that the most recent year was a 53-week year, which adds a week’s worth of revenue ($16.9 million) compared to the prior two 52 week years.

Here’s the breakdown of their revenue.  They are increasingly footwear focused.


Below is a breakdown their store locations as of February 2nd.  Texas and Georgia have the most stores.  There are only 6 in California and none up here in the Northwest.  The Northeast is also underrepresented.  At the end of their February 1, 2014 fiscal year, they had 927 stores.  At the end of their most current fiscal year, the number had risen 16.4% to 1,079.


The balance sheet at August 4, 2018 was pretty solid.  $120 million in cash, inventory down 10.1% compared to a year ago even with quarter over quarter sales growth of 12.3%.  Solid current ratio, no long-term debt.  For the 26 weeks ended August 4, cash provided by operations was $62.5 million, up from $57.2 million in the same period the previous year.

Now that we’ve been introduced to Hibbett properly, Let’s get back to the phrases I pulled from the quote and try to figure out why Hibbett is so far behind the curb in e-commerce.  They know they are, and their first listed risk factor is, “If we are unable to successfully maintain a relevant omni-channel experience for our customers, we may not be able to compete effectively and our sales and profitability may be adversely affected.”  That’s from their 10-K from last February.  It ought to say “implement” instead of “maintain.”

SGB Executive had an interesting interview with Hibbett management focusing on their e-commerce efforts.  You can read it here.  Hibbett has just launched “buy online, pick up in store” as part of their omnichannel efforts.

How does a large retailer get so far behind on something this fundamental?

Profitability and a strong balance sheet can have something to do with it.  It reduces the sense of urgency, I guess.  As you know, my point of view is that being profitable and having a great balance sheet are requirements for addressing the changing retail environment- not a reason to avoid it.

Perhaps that their stores are in smaller, under served communities has something to do with how they thought about e-commerce.  I can understand that, but the definition of “under served” has changed in the days of the internet, Amazon, and endless places to get information on and buy anything.

I also question whether the “breadth and depth” of their merchandise is better than that of their competitors in the modern retail environment.  I guess that depends on how they define their “competitors.”

Overall, their description of their business and competitive positioning with particular focus on smaller, underserved markets was valid- even insightful- in the brick and mortar environment of some years ago.  That customers belonging to their loyalty program generate 60% of their transactions says to me it’s still important.

They are running as hard as they can to catch up with the online world but have a way to go.  E-commerce sales represented 8% of revenue in the most recent quarter, and “the bulk” of their online orders are fulfilled from stores.  I don’t know how much “the bulk” is.

Apparently, they used their web site to get rid of clearance product.  That’s partly responsible for the decline in inventory.  Hopefully, they’re through that problem and have realized that using their web site for too many closeouts can have a negative impact on the Hibbett brand.  Management also talks in the conference call about e-commerce sales separately from brick and mortar.  Encouraged by the analysts they talk about a $70 million in revenue breakeven for e-commerce.

The best retailers resist distinguishing between e-commerce and brick and mortar revenues, recognizing that there’s only one revenue stream.  With total revenue declining in the last complete year, it’s kind of pyric victory for Hibbett to talk about a break even in e-commerce.  An online sale that comes at the expense of a brick and mortar sale doesn’t help you.  As most players have figured out, you end up with the same revenue but more cost.

Hibbett seems to be making some technical progress, though they’ve got a ways to go.  Perhaps more importantly, it sounds like they require an attitude adjustment.    I’ll feel way better about Hibbett once management sounds focused on how the integration of online and brick and mortar into a single revenue stream meeting customer requirements.  Until then, I’m going to think of their e-commerce efforts as reactive and defensive.

Vans Investor Day: Can They Really Do This-$3 Billion to $5 billion in Five Years? Maybe They Can.

On September 12, VF’s management team made a lengthy presentation to the investment community outlining Van’s expected future growth. In the accompanying press release they stated, “Over the next five years, the Vans® brand expects diversified and balanced growth across all product categories, channels of distribution and geographies, driven by disciplined execution and investment to continue to fuel growth.”

They expect to grow footwear “…at a five-year compounded annual growth rate (CAGR) between 10 percent and 12 percent.”  The CAGR for apparel and accessories is projected to be between 13% and 15%.  Direct to consumer is expected to be between 13% and 16% including digital growth of 30% to 35%.

Wow.  Just “WOW!”

Just so you know, I’m working from the presentation slides, press release, and some miscellaneous comments I found.  I couldn’t listen to it live and so far, there’s no transcript available, though the press release says it will eventually be.

Certainly, VF has done a fantastic job with Vans since acquiring it in 2004, growing it, we’re told, at a 17% compounded annual rate until it’s reached $3 billion in revenue.  VF President and CEO Steve Rendle says, “I am confident in the Vans team’s ability to deliver on a bold $5 billion revenue target which will be a key driver of VF’s plan to deliver superior total return to shareholders over the next five years.”  (I added the emphasis).

In writing about VF and Vans, I’ve made three main points.

First, that I have tremendous respect for VF’s systems and procedures, discipline, and portfolio management talents.

Second, echoing CEO Rendle, VF has a dependence on Vans for its overall corporate results.

Third, that I’ve never seen a brand that could grow forever without hitting some form of roadblock.

Will Vans, at least for five more years, be the exception to the rule?  In the immortal words of Rocky Rococo, “Maybe yes, maybe no.”  Let’s look at both cases.

Maybe No

The case for “no” isn’t hard to state.  Vans make’s shoes, apparel and accessories that aren’t functionally different from other brand’s shoes, apparel and accessories.  Differentiation is based largely on marketing (though that means something different from what it used to mean).  The products are already widely distributed (JC Penney, Kohls, Sears.com, Walmart for example) in a market where creating differentiation from functionally identical products has required some caution in distribution bordering, at times, on scarcity.

Where is all this new revenue going to come from?  Who are the new customers? In the presentation David Gold, Vans Vice President for Business Strategy tells us that Vans has only 6% of a $41 billion market opportunity.  For apparel it’s 1% of a $46 billion opportunity.

Vans describes itself as a skateboard-based brand.  “Skateboarding is a core differentiator for Vans,” they say.  Just to go old school for a minute, we’re seen an awful lot of brands in our industry get into trouble when they tried too hard to expand beyond their core.  In the past, I’ve written about, nay warned, to be cautious in expanding beyond the point where your potential new customers can identify with the brand because your brand strength is your main point of differentiation.

Vans sounds like they are extrapolating from the past into the future- perhaps an over simplification.  There’s no discussion in the slides of, for example, the possibility (near certainty?) of a recession in the next five years or of some other unexpected geopolitical or financial inconvenience.  And the idea that the growth will happen across all product categories, channels and geographies with nary a negative surprise does not reflect my business experience.

The presentation (download it here) is full of warm and fuzzy affirmations.  Here’s one: “VANS REMAINS AUTHENTIC TO OUR CORE CONSUMERS AND WELCOMING TO ALL.”  Can they do that?  Is it really a source of growth of the magnitude they project?  I’ve just been writing above (and in many articles over the years) about how destructive to brands that approach can be.  Go page through the presentation and see for yourself.  Are they/will they/can they all be true?  I don’t know.  When we get to the “Maybe Yes” discussion below, I’ll tell you why they might be.

The presentation is like a list of all the things all brands and retailers need to do.  I’d say it’s an accurate list.  Vans sustainable competitive advantage, then, is in its ability to do more of these things better than everybody else with more flexibility, and to develop more actionable insights.  Are they really able to execute that much better than their competitors?

The “Maybe No” case is simple to sum up.  Despite the superlative job VF has done in managing the Vans brand, where are they going to find the additional customers and revenue in an already over supplied market facing a probable recession with product that’s not fundamentally different from their competitors without damaging the brand?  Is doing the same stuff everybody else needs to do only better the source of a sustainable competitive advantage?

Maybe Yes

Let’s start by addressing the recession issue.  It’s not that a recession wouldn’t impact Vans and VF.  It will impact everybody.  But somewhere in the depth of VF (And, I can tell you, in other companies) there is recognition that the next recession will probably be the way the retail consolidation plays out.  I know things are looking better at retail right now, and let’s hope it continues.  Longer term (I’m always looking longer term) the consumer’s ability to demand more for less, the cost of providing what they demand, the continuing evolution of ecommerce, and the advantages of being a large brand or retailer suggest consolidation isn’t over.  VF and Vans will be a winner in that scenario.

Size matters.  As I’ve written about our market in general there is an advantage to being large and having a strong balance sheet.

Vans and VF have those advantages and discuss them in the presentation.  In a slide titled “Power of VF” they point to the leverage the size and sophistication of VF gives Vans.  These include:

  • Deep and complex consumer research
  • Expert-led innovation
  • Geographically diverse, efficient supply chain
  • International and DTC platforms
  • Access to capital

I suspect some of those advantages will decline over time.  Right now, they are significant.

The most interesting part of the “Maybe Yes” case is the implication that distribution doesn’t matter the way is used to.  I scoffed at brands a few years ago that said, “Don’t worry- we’re going to be in Walmart but it won’t hurt our brand.”

Vans will be thoughtful about distribution.  More importantly, they are saying that their research, resources, flexibility, brand power, speed of reaction and process of connecting to the carefully segmented consumer through surprises and experiences obviates some of the traditional concerns about distribution.  They believe they can do these things better than most of their competitors.  If so, brand perception and attractiveness will be determined more by Vans actions and less by brick and mortar retailers (Except of course for Vans own retail stores).

Finally, they’ve got the Vans brand to work with.  It’s powerful, established, and a broad range of customers feel connected to it.  Not a bad place to start.

Those are the “yes” and “no” cases in simplified form.  Vans is well into an experiment to see if a truly “omnichannel” approach to branding and customer engagement change some of the rules for growing a brand.  Because Vans is so critical to VF’s overall performance, they need to make it happen.

Zumiez’s Strong Quarter; Stores, Stash, Expansion, Strategies, Shrinkage, Wayward, the Numbers

That’s a lot to cover.  I had some hope this would be short.  Let’s start with strategy and quote CEO Rick Brooks from the conference call.

“Our top and bottom line results…are a direct result of our relentless commitment to winning with today’s empowered consumer. Our success continues to be driven by the strength of our diverse and differentiated assortments that are presented through a seamless shopping experience across all consumer touch points, accompanied by the world class customer service that our teams continue to deliver globally.”

“With the increasingly blurred lines between retail channels, we’ve moved toward a channel-less world in which the empowered consumer isn’t focused on going into a store or buying online but rather transacting with a trusted retailer. With the barriers between the physical and digital worlds coming down and the increased speed at which individuals communicate, trend cycles are rotating faster than ever before. The same holds true for the pace at which demand for emerging brands can go from local to global in nature. In this type of environment where consumers can access so much information, a new level of transparency in retail is being created that is driving out inefficiencies within the market and forcing consolidation in the industry.”

It’s conceptually that simple, but really complicated to do, requiring a long-term perspective, flexibility in thinking and structure, a different attitude towards risk, and a strong balance sheet.  What, exactly, is the formula for management structure and discipline on the one hand, but raging flexibility on the other?

The bottom line, as you see in the quote, is that Rick thinks many of Zumiez’s competitors can’t do it.  Is just operating at the level required by the new environment now a long term strategic advantage?

Rick also commented about trends rotating faster than ever.  A couple of years ago, Rick was expressing the belief that longer trends would return.  It looks like he’s changed his thinking as the competitive environment required.

Okay, on to Wayward.  There’s no mention of the Wayward stores Zumiez has opened.  There are only two, they haven’t been open long, and the numbers are obviously not significant.  But I liked the concept and am kind of curious.

At the end of the quarter on August 4, Zumiez had 611 stores in the U.S., 50 in Canada (Room for more growth there? I’d guess not much), 35 in Europe- Blue Tomato, and 7 in Australia- Fast Times.  They expect to open 13 stores this fiscal year including five in the U.S., seven in Europe, and one in Australia.  I want to put that in context of their comment on expansion in the 10Q.

“We plan to continue to open new stores in the Canadian, European, and Australian markets. We may continue to expand internationally in other markets, either organically, or through additional acquisitions.”

That’s part of a risk factor telling us that theirs plans for international factors could be, well, risky.  Zumiez has acknowledged that they were running out of room for new stores in the U.S.  However, their concept of “trade areas” and a channel-less world coupled with ongoing industry consolidation makes me wonder if they can’t grow revenues in the U.S. without more stores.  I am certain they are wondering too.  There’s no reason that concept would only apply to the U.S.

CFO Chris Work reminds us in the conference call that Zumiez is doing almost 100% of their ecommerce fulfillment in their stores.  It sounds like they are doing it without much added expense.  In a previous call (but only one I think) Rick told us how in store fulfillment was allowing Zumiez to spread the cost of these sales over the existing expense structure.  That is very powerful.  I’m surprised nobody is pushing for more details.

In recent quarters, Zumiez has noted an issue they are having with shrinkage.  Chris says it cost them about $5.4 million in 2017, and they are continuing to work on it.  I wanted to raise it in conjunction with in store fulfillment because I have the sense the two happened around the same time.  I know correlation doesn’t prove causality, but I’m intrigued.  I almost hope it’s somehow related to that.  Zumiez decades long process of hiring, supporting, training, and advancing people who are part of Zumiez’s customer base has been key to their success.  I would think/hope it would mitigate against shrinkage.  If suddenly it’s not, I’d be concerned.  Shrinkage in the quarter was 0.3% lower than in last year’s quarter.

Last, but not least, their loyalty program called Stash.  What I wanted you to think about is that loyalty programs become more valuable as the quality of your algorithms and customer data rises.

Finally, we get to the numbers.  Revenues in the quarter rose 13.9% to $219 million, up from $192 million in the same quarter last year.  U.S. revenues rose 14.2% from $165 to $189 million.  In Canada, the increase was from $11.3 to $12.5 million.  Europe rose 14.8% from $11.3 to $16.1 million.  Australia rose from $1.687 million to $1.787 million, or by 5.5%.  Overall, U.S. revenue represented 86.15% of the total, up from 85.94 in last year’s quarter.  I imagine the U.S. percentage might be lower if not for the strong U.S. dollar.

“The [revenue] increase primarily reflected an increase in comparable sales of $12.8 million, an increase of $9.9 million due to the calendar shift to include an additional week of back-to-school season, and the net addition of 11 stores (made up of 10 new stores in North America, 5 new stores in Europe and 1 new store in Australia partially offset by 5 store closures in North America) subsequent to July 29, 2017.”

Comparable store sales rose 6.3%.

The gross margin rose from 31.1% to 33.1%.  “The increase was primarily driven by 160 basis point leveraging of our store occupancy costs, 30 basis point increase in product margin and 30 basis points in lower shrinkage of inventory partially offset by 30 basis points in higher shipping costs.”  Note the impact of leveraging occupancy costs and refer to the discussion of in store ecommerce fulfillment.

SG&A expenses as a percent of net sales decreased 150 basis points for the three months ended August 4, 2018 to 30.0%.  “The decrease was primarily driven by 140 basis points from the leveraging of our store costs and 40 basis points decrease due to the timing of annual training events partially offset by a 40 basis point increase related to the accrual of annual incentive compensation.”

There’s that improvement due to leveraging store costs again.  I’m growing very fond of in store ecommerce fulfillment.

Net income rose from a loss of $608,000 to a profit of $4.38 million.  That’s usually what happens when you increase revenue and gross margin while reducing expense as a percent of revenue.

The balance sheet remains strong with more cash and no long-term debt.  Cash provided by operating activities was $15.5 million for six months, up from $3.77 million in the same six months last year.  I’m wondering why they’ve got $5.6 million in short term debt on the balance sheet given all the cash they’ve got.  Maybe it’s a non-U.S. thing.

Good quarter.  As usual, there are interesting things to think about in the 10Q and conference call if you read carefully.  I look forward to their next quarter.

“A Destination Retailer.” Tilly’s August 4 Quarter

In its 10-Q Tilly’s describes itself as “…a leading destination specialty retailer of casual apparel, footwear and accessories for young men, young women, boys and girls with an extensive assortment of iconic global, emerging, and proprietary brands rooted in an active and social lifestyle.”

We all know what a destination retailer is; a store that customers go out of their way to shop in.  I think Tilly’s has to be a destination retailer because of where they locate their stores; “…in malls, lifestyle centers, ‘power’ centers, community centers, outlet centers and street-front locations.”  If you are a destination retailer, you can be a bit more agnostic about locations.  You can put them where it makes  sense from a cost of operation perspective.  As they put it in a recent 8-K filing, “We have a flexible real estate strategy across real estate venues and geographies.”

Tilly’s “…operated 226 stores, including three RSQ-branded pop-up stores, in 31 states as of August 4, 2018 …Customers may also shop online, where we feature the same assortment of products as carried in our brick-and-mortar stores, supplemented by additional online-only styles. Our goal is to serve as a destination for the latest, most relevant merchandise and brands important to our customers.”

I want to note the use of pop-up stores.  These are not just tents which are there for a day or a week.  They average 2,600 square feet.  Tilly’s standard stores average 7.600 square feet.

I expect these are short term (months?) leases from owners happy to have somebody paying them some money.  I expect to see more of this- not just from Tilly’s.

The question is how you become a destination retailer if you carry many to most of the same brands your competitors carry.  Look at the brands they carry here.

From the same 8-K mentioned above, here’s how Tilly’s describes their efforts to differentiate their stores and be a destination retailer.

“We believe our experiential marketing efforts in our stores foster an environment that is vibrant, stimulating and authentic, serving as an extension to our customers’ individuality and passion for an active, connected lifestyle. We accomplish this by blending the most relevant brands and styles with music videos, product-related visuals and a dedicated team of passionate store associates. We continuously think of fun, creative ways to drive consumers to our stores, including augmented and virtual reality experiences, various social events, and partnerships with some of our vendors, all of which are posted on various social media platforms, further driving brand awareness. Additionally, in order to improve the look and feel of our stores, we have remodeled or refreshed nearly 90% of our stores in the last three years.”

Decide for yourself whether Tilly’s is a destination retailer.  The point I want to make is that being a destination retailer combined with skill and agility in managing your store portfolio is a very positive combination, as each of those characteristics enables the other.

Tilly’s had some problems during its fiscal 2012 through 2015 years.  Things started to improve after they brought in Ed Thomas as CEO in October of 2015.  If you read in that 8-K what they believe their strength are, you won’t find much different from what other successful brands and retailers are doing.  The question, as usual, is whether you have the balance sheet and management team to do these “things of importance” better than the competition.

Tilly’s has a solid balance sheet, allowing them to think long term, react to bumps in the road, and deal, or even prosper, in an economic downturn which, I guess, will eventually happen.  In the first six months of their fiscal year, cash generated from operations was $22.0 million, up from $2.87 million in the first six months of last fiscal year.

Revenues for the quarter ended August 4, 2018 were $157.4 million, up 13.4% from $138.8 million in the same quarter last year.  E-commerce revenues rose from $16.6 to $19.7 million, or by 18.7% and represented 12.5% of total revenues, up from 12.1% in last year’s quarter.  Comparable store sales, including e-commerce, were up 4.4% compared to an increase of 2.1% in last year’s quarter.

Of the $18.6 million increase in revenue, $12.3 million was the result of the quarter having a 53rd week.  It happens every few years.

The gross profit margin rose from 29.5% to 31.8%.  Product margins were flat.

SG&A expense as a percent of revenue fell from 30.4% to 23.9%.  In dollars it declined from $42.2 to $37.6 million.  This was the result of a reduction in legal expense of $7.6 million compared to last year’s quarter.

Operating income improved dramatically from a loss of $1.2 million to a profit of $12.5 million.  However, “Of this $15.4 million improvement in year-over-year operating income, approximately $7.6 million was attributable to the aggregate year-over-year impact of the legal matter noted above, approximately $5.2 million was attributable to the retail calendar shift impact noted earlier, and approximately $2.6 million was attributable to increased comparable store net sales results.”

Net income improved from a loss of $596,000 to a profit of $9.7 million, but don’t forget the impact of the factors mentioned in the paragraph above.

Tilly’s is doing a lot of what I think are the right things. We’ll see if they can continue to do them better than some of their competition.

Globe Had a Good Year- But It’s Hard to Tell How They Did It

I like Globe.  They’ve always had a good attitude, have been able to spot opportunities, and have acknowledged and moved to correct mistakes when they happened.  They are, as a result, a company I want to write about because I think we might all learn something.

Unfortunately, their required statutory report for the year ended June 30, 2018 is somewhere between not much and no help.  How can a 60-page report not even list the brands they own and tell us at least a bit about how they are doing?

The answer is that Globe is closely held by the Hills, has few shareholders, isn’t closely followed by the analysts and, last but certainly not least, is operating under Australian accounting rules.  I may not like the paucity of information, but in their place, I’d do the same thing.  Let’s see if I can glean a bit of useful data from what they do tell us.  Remember, all numbers are in Australian dollars.  One Australian dollar will cost you around 72 U.S. cents.

Revenue rose $7.2 million (5.16%) from $140.5 to $147.7 million.  All the growth happened in the second half of the year.

Revenues in Australasia rose 1.75% from $77.1 to $78.4 million.  EBITDA grew from $12.2 to $14.6 million, or by 19.7%.  The rise in EBITDA, we are told, was mostly driven by “…sales and profit growth in the workwear division.”

North American revenues were up 10.5% from $42.0 to $46.4 million.  EBITDA in that segment went from a loss of $1.25 million to a profit of $1.56 million.  “This turn-around was a result of the restructuring that was completed during the 2017 financial year, as well as an 11% increase in revenues driven by new apparel initiatives.”

Europe revenues rose from $21.4 to $22.9 million, or by 7.0%.  It’s EBITDA was $636,000, up 0.8% from $631,000.  All they tell us is that “The European business reported modest growth in sales and profitability.”  Well, that’s helpful.

What I hear is that workwear and apparel are responsible for most of the revenue growth.  Does that imply some stagnation in some of the hard goods driven brands?  How are shoes doing?

The gross margin rose 1.4% “…driven by sales mix and favorable foreign exchange impacts.”  Using Globe’s “Revenue from operations” number and what they call “Cost of sales” in Note 4, I calculate a gross margin as having risen from 45.8% to 47.8%.

I am sure they are right and that I don’t understand what “Cost of sales” includes.  But the calculation I did gives a better result than what they report.  Obviously, cost of sales can include more costs than the expenses included in gross margin, but if that was true then wouldn’t my calculated “gross margin” be less than what they reported?

Moan.  I need a footnote to the footnote.

Selling and administrative expenses rose 7.9% from $36.6 million last year to $39.5 in the most recent year.  Employee benefits expense was down very slightly to $21.4 million.  Net income rose 66.1% from $5.08 to $8.4 million.  There’s no discussion of the changes. The balance sheet is solid.

I want to thank Globe for providing a report that made it impossible for me to spend much time analyzing it.  I confess I don’t entirely miss having Billabong’s public filings to try to figure out every six months.

Globe seems to be a company changing its focus to apparel and workwear.  Not a surprise given the current state of growth opportunities in hard goods. They are managing the transition while keeping the balance sheet strong and earning more money.  There is something about their culture that makes them early recognizers of market changes and willing to act on that knowledge.

Deckers Has Strong Quarter- Sanuk Feels Like an Afterthought

With its restructuring expenses largely behind it ($55.3 million since February 2016) and net sales up 19.5% for the quarter ended June 30 compared to the same quarter last year, Deckers reported a good result.  Sanuk continues to be the laggard, and I still won’t be surprised to see Deckers management sell the brand, though for orders of magnitude less than they paid for it.

Revenue rose to $251 million from $210 million in last year’s quarter.  The chart below compares revenues for both quarters and shows the percentage change for each brand.  Also included is the breakdown between international and U.S. revenues.


Note the continued dominance of the UGG brand and the revenue growth of all the brands except Sanuk, which was down 6.6%.  They report in the 10-Q that “Wholesale net sales of our Sanuk brand decreased due to a lower volume of pairs sold primarily driven by lower performance in the US surf specialty channel and lower international sales in connection with our strategic focus on US markets for this brand.”

The gross profit margin rose from 43.2% to 45.9%.  The increase “…primarily driven by favorable foreign currency exchange rate fluctuations, improved full-price selling compared to the prior period, and lower input costs as we execute our supply chain initiatives as part of our operating profit improvement plan.”

SG&A expenses fell from 70% to 61.6% of revenue while growing in dollars from $147 to $154 million.  The pretax loss declined 30.9% from $56.6 to $39.1 million.  The net loss fell from $42.1 to $30.4 million, or by 27.8%.  Note that about $10 million of revenue was shipped early and had been expected to be part of the current quarter.  The question is whether that means the current quarter’s revenue will be $10 million below what it would otherwise have been.  There were also “certain operating expenses” shifted to the current quarter.  They don’t say how much.

Remember that corporate tax rates are lower this year.  As with other companies, this is Deckers’ weakest quarter.

Below is a table showing the operating income by brand and the change from last year’s quarter.  Note that all the brands are up except poor Sanuk.  Deckers also has some work to do on its direct to consumer business and has been busily rationalizing its brick and mortar footprint, and this may lead to some further charges.

“At June 30, 2018, we had a total of 160 retail stores worldwide, which includes 93 concept stores and 67 outlet stores. During the three months ended June 30, 2018, we opened one and closed six concept stores… Management continues to target an overall reduction in our worldwide retail store count.”


They make a comment that Sanuk’s lower operating profit was the result of lower sales offset by higher gross margins.  Hopefully, that’s in indication of distribution getting cleaner.

The balance sheet is solid, and I’d note a small inventory decrease from $442 to $436 million even with the sales increase.  I love the turnaround in cash from operations.  It was a negative $7.35 million in last year’s quarter.  It’s a positive $8.07 million in this year’s.

Deckers has improved their spending efficiency, and the benefits will continue to grow into fiscal 2020.  They’ve improved their distribution.  CEO Dave Powers says, “We have closed a few hundred doors over the last 18 months, and are really focusing on the top 15 strategic accounts that are driving the majority of the volume.  We’ll continue to do that.  And I think naturally there’ll be some accounts that will close on their own, just continuing through the marketplace disruption that’s happening out there…”

There’s a lot of that kind of distribution consolidation going on.  Advantage, big players.

Deckers is continuing to rationalize its brick and mortar business.  I’d feel better if I heard them talk more about how they are tying it to ecommerce.

Higher sales with a higher gross margin, improved distribution, and lower SG&A as a percent of revenues is a good thing.  Sanuk is a bit of a fly in the ointment and I wonder if its potential justifies it being part of a public company.