Light at the End of the Tunnel – But it’s Not a Short Tunnel; Billabong’s Annual Report

What we have here is progress, but still a long way to go. That’s how Billabong’s management characterizes their results, and I agree. I’ll take a look at the financials as reported and with the impact of divestures and certain “significant items” removed. Regular readers know I’m not quite comfortable with some of the stuff that Billabong management characterizes as “significant” and removes from their operating results. Happily, the number has declined dramatically for the June 30 fiscal year.

Next, I want to touch on exchange rates and how they affect the results. It’s way more complicated than is the Australian dollar “strong” or “weak,” though that’s often how the issue is characterized.

Finally, I want to talk about how extensive and complex Billabong’s makeover is. Basically, they are rebuilding the company while running it. It’s kind of like highway construction, where you have to keep the road open while you redo it. It adds cost and slows down the process, but you’ve got no choice.

I want to point you to Billabong’s investor web site, where you’ll find the documents I discuss. Under “Featured Report,” I particularly suggest you take a look at the full year report presentation which they refer to in the conference call. The transcript of the conference call is also there.

Financial Results

All the numbers are in Australian dollars unless I say otherwise. At June 30, it costs you about $0.75 US to buy one Australian dollar.

For the year ended June 30, 2015, what they call “Revenue from continuing operations” was reported on the official financial statement as $1.056 billion (US$792 million based on the June 30 exchange rate). That’s up 2.82% from the prior calendar period (pcp) result of $1.027 billion. That does not include $10.6 million of other income this year and $6.3 million of other income in the pcp. It does include the revenue from brands that were divested at some point during the two years.

Gross margin rose from 52.2% to 53.1%. Selling, general and administrative expenses rose 1.6% from $423 to $429.6 million. Other expenses fell 23.1% from $165.9 to $127.7 million. Finance costs declined from $82.2 to $34.3 million, or by 58.3%. As you’ll see, much of those two declines were the result of the restructuring and refinancing expenses in the pcp.

Below is the rest of the income statement. Seems easier to show you than to describe it. The first column is for the year ended June 30, 2015 and the second for the pcp.

Billabong 6-30-15 annual report 1


As you can see, as reported Billabong earned $4.15 million compared to a loss of $233.7 million in the prior calendar period. Mostly, the change from a big loss to a small profit is due to a reduction in all the costly tax, restructuring, and financial expenses they had last year.

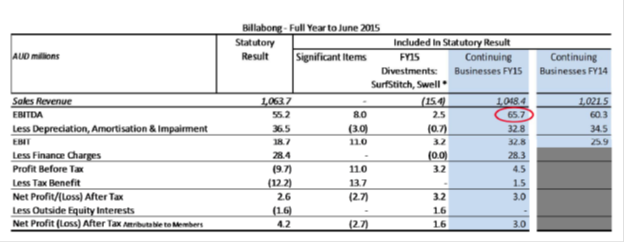
Okay, now let’s take out the businesses they sold and their significant items. They do that for us in the presentation they used at the conference call. Page 22. Billabong sold it’s 51% stake in SurfStitch and it’s 100% ownership in Swell on September 5, 2014, which is in the most recently ended fiscal year.  West 49 was sold in February of 2014. Dakine was out the door in July of 2013. Discontinued operations generated $196 million of revenue in fiscal 2014, but only $15.4 million in fiscal 2015.

Billabong 6-30-15 annual report 2


The first thing I’ll point out before somebody points it out for me is that the Sales Revenue number of $1,063.7 million is not the same as in the numbers from the official financial statement I just quoted. I’m not saying it’s wrong. I just can’t figure out why it’s different.

Taking out those items leaves us with a slightly reduced net income (from $4.2 to $3.0 million) for the June 30, 2015 fiscal year. More importantly, comparing the last two columns in the chart, you see an increase in EBIT from $25.9 million in the pcp to $32.8 million for the June 30, 2015 year.

Okay, significant items. For you data geeks, go to the Billabong investor web site. Under “Featured Reports” click on “Full Year Reports to 30 June 2015.” Go to page 69. Look at note (dd) “Significant Items.” I won’t blame you if you don’t read every word, but you might just peruse the list and note the discretion management seems to have in terms of what is or is not classified as a significant item.

If you want to suffer even more, go to page 86 of the same document where Note 8 starts. It lists all the significant items for the recently ended fiscal year and the pcp. A more detailed description of just what those items are appears on the next two pages.

What!?! You didn’t hang on each word?! Yeah, me neither.

The good news is that the significant items from continuing operations totaled $24.7 million this year compared to $120 million in the pcp. After discontinued operations, the total fell from $146 to $11 million.

You can’t just ignore numbers of this size, and certainly some of these are one time numbers. But if I were an investor, or potential investor, in Billabong, I’d be digging into these to satisfy myself as to the improvement of the continuing business from last year to this year.

Now let’s move on to the results by segment. First, as reported.

Billabong 6-30-15 annual report 3


You can observe revenue drops for Asia Pacific, the Americas, and Europe of 10.8%, 15.3%, and 9.7% respectively. EBITDAI fell by 28.3% in Asia Pacific, but improved dramatically in the other two segments. The result is a $107 million turnaround is EBITDA as reported.

Taking out the discontinued operations and significant items gives a different segment and total EBITDAI result. The change in EBITDAI is not nearly as dramatic but, then again, it shows as positive in the pcp.

Billabong 6-30-15 annual report 4


The next chart in the report is EBITDAI in constant currency. I’m not even going to show you that and I guess this is a good place to explain why.

Foreign Exchange

In the first place, if you’re an Australian investor in Billabong, I expect you mostly care about results in Australian dollars. But perhaps more importantly, there is a complexity here that goes way beyond whether the Australian dollar is “strong” or “weak” against the US dollar.

Billabong management does a great job trying to highlight and explain this. They provide a chart on page 71 of the document I point you to above that shows their exposure in Australian dollars, US dollars, Euros, and “other” currencies. There are both assets and liabilities involved and, if most of the exposure is in the first three currencies the “other” is not insignificant. Billabong “…receives revenue in more than ten currencies…”

In the conference call CFO Peter Myers spends way more time on this issue than I would have expected. Just to give you a way to think about all the moving parts, here are a few things he says. This would be a place where you can skim a few paragraphs if you want to, but I think it’s important.

“As an Australian listed entity with US operations, it is logical for us to have a significant part of our debt denominated in US dollars to match our foreign currency assets with foreign currency debt. So whilst it is true that the Aussie dollar equivalent of our debt is higher, so is the Aussie dollar value of our businesses and our US dollar earnings…”

“…the Aussie dollar value of businesses that are predominantly US-based, like RVKA and BZ, and the value of our US dollar earnings from our more global businesses like Billabong are also growing in Australian dollar terms. We also have US dollar cash flows to match our US dollar interest obligations.”

“So before that allocation of central costs, the Australian dollar value of the earnings from the Americas was AUD42 million, or about $35 million. So you see we have the Americas give us US dollar EBITDA of $35 million to match our US dollar interest obligations of $25 million, but — and it’s a significant but — it does serve to reinforce how important it is to us that we build the earnings base in North America, as it’s obvious the FX changes do impact on all of our financial ratios, et cetera.”

“The other big impact of the currency is in our input prices, the product purchases. In APAC alone, and bear in mind there is a European effect here as well, we have cost of goods sold of over AUD150 million, the vast majority of which is bought in the US dollar-exposed market.”

Sorry to let Pete go on for quite so long there, but I thought it important you appreciate the complexity and all the moving parts. While currency movements in the recently ended year may have been more dramatic than usual, the issue isn’t going away. At the end of the day, however, it’s how many Australian dollars of net income Billabong generates that will be the barometer of the company’s success or failure.

Reducing Complexity

Billabong’s brands include Billabong, Element, RVCA, Kustom, Palmers, Honolua, Xcel, Tigerlily, Sector 9 and Von Zipper.

“The Group operates 404 retail stores as at 30 June 2015 in regions/countries around the world including but not limited to: North America (60 stores), Europe (102 stores), Australia (123 stores), New Zealand (30 stores), Japan (46 stores) and South Africa (27 stores). Stores trade under a variety of banners including but not limited to: Billabong, Element, Surf Dive ‘n’ Ski (SDS), Jetty Surf, Rush, Amazon, Honolua, Two Seasons and Quiet Flight. The Group also operates online retail ecommerce for each of its key brands.”

Some of those stores carry multiple brands. Others don’t. About 55% of revenues are from wholesale. No single customer is 10% or more of their revenues. They expect to close around 40 stores this year, but have a new store model they believe gives them the opportunity to open new ones, so the net number of stores may not change much.

That’s a lot of moving parts in a lot of countries for a company that did just over a billion dollars Australian during the recently ended year. You probably also recall that Billabong’s brands operated pretty independently for a long time. The company is moving to change that in the name of efficiency and brand building. To me, Billabong really couldn’t support the implicit inefficiencies in the structure it had with the revenues it’s generating.

Let’s see what they’re doing.

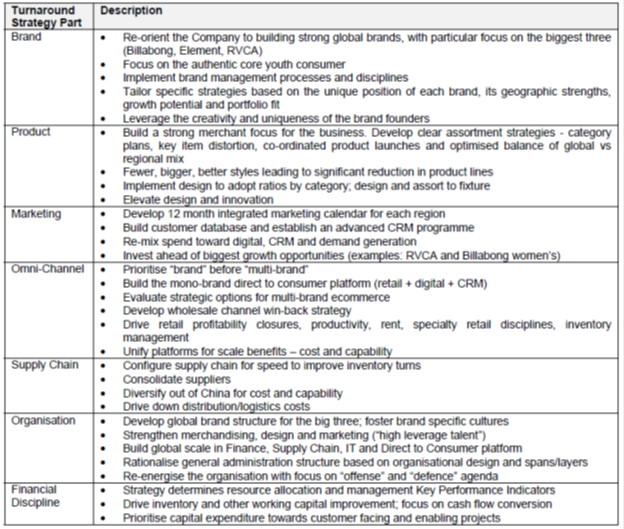
CEO Neil Fiske has a seven part strategy the company has been implementing since shortly after he came on board in September, 2013. From their filed report, here are the strategies and descriptions of what they involve.

Billabong 6-30-15 annual report 5


I want to make a few general comments on this. First, you should note that pretty much no part of the business is untouched. Second, while this will ultimately save them a lot of money (they have for example cut the numbers of suppliers they work with by 50%) it’s going to cost a bunch of money to implement.

Third, there is a certain urgency to doing all this, and an imperative to interconnect these functions that wasn’t so important or at least so necessary 10 years ago. And I will point out that doing much of this doesn’t create a long term competitive advantage. It’s just what Billabong, as well as other larger companies in our space, have to do to have the chance to compete. Certainly when you looked at the chart above you noted that many of the actions they are taking seem obvious and necessary.

You may even have asked, “How the hell can they not have done this stuff before now!” I have no idea what went on inside Billabong, but trying being the CEO of a publicly traded corporation and explaining to your board of directors that you’re going to rip the place apart, it’s going to take a couple of years to reconfigure, it will cost a lot of money, it may not work out, and in the meantime, your earnings are going to suck. Good luck with that.

Typically, the pressure has to come from an outside change agent.

Neil also talks about their “…fewer, bigger, better…” approach. This means that they are focusing on their three big brands; Billabong, RVCA and Element. That was a financial imperative for a money losing company, and it’s certainly the place where they can see the most immediate return. Think of it in percentage terms. A 5% increase in Billabong branded sales is way more dollars than a 5% increase in Von Zipper, and larger brands will benefit more from the various restructurings going on.

The other brands aren’t insignificant, though we don’t know how much revenue they are doing. We are told the big three represent something like two-thirds of the wholesale business worldwide.

CEO Fiske tells us that “…Tigerlily has shown standout performance once again. Sales are up over 40% and comp store sales grew 7.8% for the year. Collectively, the rest of the emerging brand portfolio was down in sales and EBITDA. With the progress of the big three brands well underway, we can now focus on the strategy and the performance of the emerging brands.”

This is the first time they’ve said much about the other brands. I still won’t be surprised if more get sold, but it’s hopeful that they think they have the breathing room to give them some attention.

Here’s a series of comment Neil made about Europe. “Gross margins [He’s talking in constant currency] lifted 650 basis points for the year as we focused on quality revenue, quality accounts, quality distribution…Revenue for the year declined 1.7% as a result of our decision to narrow our account base, tighten trading terms and build margin… In retail, comp store sales for the region were up 2.9%. Store level profitability improved 160 basis points before the effect of provisions, driven by the improvement in retail gross margins. Total store count at year end was down from 111 to 102 as we rationalized our network of outlet stores from 24 to 17 and country presence from nine to five.”

 I added the emphasis. Note the focus on quality, simplification, margin, branding and efficiency over sales growth. Or rather, the confidence that those things will lead to sales growth. This is a theme not just for their European operations, but across the other segments and found in their strategy as well.

I haven’t focused as much on brand and segment specifics as in previous Billabong reports. I really don’t want us to get lost in the weeds right now.

I’m kind of going “Billabong blind” from shuffling through all these documents and trying to create a coherent whole, but I think it was CFO Myers who said, somewhere, that he was surprised to be calling such a small profit a turning point for the company.

I know what he means. Currency, significant items (I know, I just can’t leave that alone) and divestitures make it something of a challenge to compare results over years, but there is the sense that the elements of the strategic makeover are starting to have an impact. Maybe a better way to put it is that it really feels for the first time like rebuilding the road while they drive on it is something that has a reasonable chance of succeeding.

The balance sheet is at least stable. Operating results seem to be improving and even where they aren’t improving, there’s some sense of progress in doing the things that will improve them.

The problem is most definitely not solved. There are currency issues, work remains on their retail operations, the overall economic environment isn’t too great, and completion of the systems and structural transition will take a couple of years. But things are better than a year ago and the path seems a bit clearer.

Deckers June 30 Quarter and Some Perspective on Sanuk

It wasn’t a great quarter for Deckers, the owner of UGG and Teva as well as Sanuk, though let me start out by reminding you that seasonality means this is always Deckers’ worst quarter.

Sales rose 1.1% from $211.5 to $213.8 million. The gross profit margin fell slightly from 41% to 40.5%. SG&A expenses rose steeply from $37.3 to $47.3 million. The operating loss jumped 26% from $50.5 to $63.7 million.

The net loss also rose from $37.1 to $47.3 million, or by 27.5%. It’s less than the operating loss due to tax benefits of $13.7 million in last year’s quarter and $17.4 million in this year’s.

Sanuk, we find further on, had wholesale revenues for the quarter of $28.5 million, down 11.6% from $32.3 million in last year’s quarter. Operating income on that wholesale business fell 22.6% from $6.9 to $5.3 million.

Read more

SPY’s June 30 Quarter; Kind of More of the Same

As usual, I’ll start off my discussion of SPY by saying how much I like the brand and how I think they’ve done most of the right things in terms of operations and brand positioning. But then I move on to the financials (the June 30 quarter in this case) and bemoan, as I have before, how they are smaller in revenues than they need to be to get traction in the highly competitive sunglass market and support spending at the level required.

I don’t really even care about the $21.5 million payable to stockholders on the balance sheet. True, there’s some interest expense, but that’s been reduced since the debt holder reduced the interest rate last year. The only thing that debt does is prevent the company from being sold, which I think would have happened without that debt sitting there.

Revenues fell 0.75% to $8.12 million compared to $8.18 million in last year’s quarter. U.S. and Canadian revenues fell 1.64% from $7.03 to $6.91 million. In the rest of the world, they rose 4.67% from $1.16 to $1.21 million. They don’t discuss the impact of currencies, but I’d tend to look at that increase as being pretty good given the strength of the U.S. dollar. Here’s how they describe the sales decline.

“The period over period decrease in sales is principally attributable to lower sales of our prescription frames and goggle product lines which each decreased by $0.2 million, or 21.5% and 37.4% respectively… The decrease was partially offset by an increase in sales of our sunglasses, which increased by $0.2 million or 2.5%. Sales also included approximately $1.2 million and $0.3million of sales during the three months ended June 30, 2015 and June 30, 2014, respectively, which were considered to be closeouts.”

First, with just a little mental math you can see that the prescription frame business must be pretty small if a decline of $200,000 means that revenues fell by 21.5%. You can make the same argument for the 37.4% decline in goggles, though I’d be a bit more cautious given the seasonality of that business. Here’s the percentage of sales by product line from the 10Q.

SPY 6-30 10q 8-15


What’s of more concern to me is the $1.2 million in closeout business compared to $0.3 million in last year’s quarter. I’ve previously commented that SPY seemed to be getting inventory issues under control, but now I’m not so sure. The June 30 balance sheet shows a 21.2% increase in inventory from $6.56 to $7.95 million.

The gross margin took a big hit falling from 55.5% to 49.5%. Here’s what they say about the decline.

“Gross profit as a percentage of net sales was 49.5% for the three months ended June 30, 2015, compared to 55.5% for the three months ended June 30, 2014. The decrease in our gross profit as a percent of net sales during the three months ended June 30, 2015 compared to the same period in 2014 was primarily due to: (i) higher sales of closeout products at reduced price levels and (ii) lower sales of higher margin prescription frames.”

That seems to confirm inventory is an issue.

They continue to reduce operating expenses, which fell from $4.4 to $4.1 million. Interestingly, they have given early notice that they are terminating the lease on their headquarters and, in December of this year, expect to move to a new facility. Rent will rise from around $29,000 a month to $48,000.

The fall in the gross margin meant that operating income went from a positive $101,000 to a loss of $42,000. Interest expense was down from $751,000 to $491,000 for the reason I mentioned above. There was still a net loss, but it was down from $742,000 to $516,000. That’s less than the decline in interest expense.

On the balance sheet, equity is negative at $17.7 million. Practically speaking, however, you can consider the notes due to shareholder as equity. The current ratio declined a bit from 1.49 to 1.27. Current assets were up around $1 million, but the current liabilities rose more on the back of an increase in the line of credit.

That’s kind of it. If I could dig into one thing, it would the rise in inventory and the closeouts. I’d like to know it doesn’t indicate an issue with product acceptance in the market.

The Beat Goes On- Skullcandy’s Results for the June 30 Quarter

Since right after he joined the company, Skull CEO Hoby Darling has been pushing the same five pillar strategic plan as the company works through its issues and out of turnaround mode. I’ve reviewed those five pillars every quarter since he presented them, and I think I’m done.  You can go read one of my earlier articles or the conference call transcript if you need your memory refreshed.

Those five pillars are hardly unique to Skull- some of them are things that need to be done well by any company. But what I like is that they aren’t “things you have to do in a turnaround.” They are five targets, or areas of focus, that provided when he presented them, and continue to provide, a focus and consensus about how Skullcandy expects to succeed.

Read more

VF’s June 30 Quarter: Damn This Strong Dollar!

VF reported a 4.62% revenue increase in the quarter that ended June 30 compared to the same quarter last year (prior calendar period- PCP). The increase was from $2.402 to $2.514 billion. As usual, we’ll focus on the Outdoor & Action Sports (OAS) segment, as that’s where most of the action seems to be.

Below is the chart from the 10Q that lays out the revenues and operating profits of each of VF’s segments for the quarter and the half year.

Read more

Volcom and Electric Results for the Quarter and Half Year

Let’s review. Volcom and Electric are in Kering’s sport and lifestyle (S&L) division which includes PUMA. In 2014, Kering had consolidated revenue of 10.038 billion Euros. The S&L division’s revenue was 3.245 billion Euros. Of that, PUMA was 2.99 billion Euros and “other brands” in S&L had revenue of 255 million Euro and operating profit of 10 million Euro (see chart below).

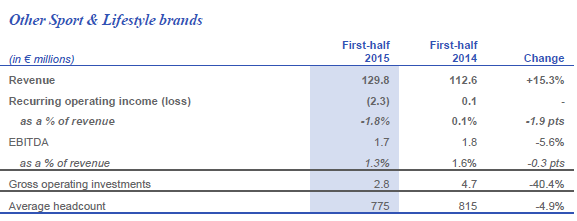
Other brand revenue in the S&L division (which I think is Volcom and Electric) rose in the quarter ended June 30, 2015 to 64.8 million Euros from 53 million in the same quarter last year. That a gain of 22.3% as reported. For the six months ended June 3, revenue rose 15.3% from 112.6 to 129.8 million Euros. You can discern from those numbers that the second quarter was better than the first.

The chart below from Kering’s report shows the results for the first half of both years. You’ll note that there’s a small operating loss shown even with the revenue increase and a 5% reduction in headcount.

Kering 6-30 report #1


In the conference call, we’re told there was a “…muted first half…” for Volcom and Electric. Trends improved in the second quarter with revenue up 2.6% based on constant currency. Volcom’s second quarter growth was reported to be 6%, also using constant currency. If Volcom revenues were up 6% in the second quarter, but Volcom and Electric together were up 3%, then I have to conclude that Electric was down. That’s what the financial report says.

“After a major repositioning drive in the accessories market and a complete overhaul of its offeringaround new ranges of sunglasses, snow goggles and watches during the previous two years, Electric reported strong sales growth in 2014. However, as substantially all of the brand’s sales are now generated through the wholesale distribution channel, its revenue declined in the first half of 2015, weighed down by wholesalers’ wait-and-see attitude during the period as well as by a less favourable delivery schedule.”

Sunglasses are a tough business.

The financial report refers to “…ongoing tough market conditions for Surfwear and Action Sports.”  Wholesale revenues rose 0.8% and store sales were up 6.6% and represented 15% of total sales. Those numbers are in constant currency. Volcom had 52 stores at the end of the quarter “…including nine in emerging markets.”

Talking just about Volcom, the report stated, “In North America – still the brand’s main market, representing 67.3% of revenue – sales rose 1.3% on a comparable basis. Revenue contracted in Western Europe and remained stable in Japan, although these effects were offset by extremely encouraging business development in emerging markets, particularly in the Asia-Pacific region.”

Well, that’s kind of it. As usual, there wasn’t a lot of information. Damn, it’s a tough market out there. I think Volcom can be more valuable to Kering than their revenues or results so far suggest because of who the customer is. I hope Kering understands that.

GoPro’s Quarter. What Kind of Company is This Anyway?

Isn’t it interesting that I’m writing about GoPro at all? In 1995 I wrote my first column for Transworld Snowboarding Business and now, somehow, I’m writing about a consumer electronics company.

Relax GoPro people. I know you aren’t really a consumer electronics company. Or at least, you don’t want to be even though right now almost all your revenues come from your cameras. I’d go so far as to say that if you end up as a consumer electronics company, your competitive position will be uncertain bordering on unsustainable no matter how much you spend on R&D.

Read more

What I Saw at Agenda

The first thing that happened when I walked in the door was I got lost. They’d reorganized a bit and it took me a minute to get oriented. My problem- not Agenda’s. When I saw they had finally opened up the Berrics and included it in the flow of the show I was happy and more than willing to be slightly disoriented for a minute. Excuse me for pointing out I suggested doing that a couple of years ago.

I was also glad to see that they had mostly kept the booths small. There was the inevitable expansion of a few of the larger brands, but as long as we can stay away from two stories, I’m happy. I think most brands have figured out it’s your consumer, not your competitors, you need to impress. It’s a very democratic show. That’s a good thing.

Read more

Reading Between the Lines: Zumiez’s May 2nd Quarter

It seems a hard time to be retailer in our space- at least that’s my general perception as I pour through conference calls and SEC filings. It’s not that Zumiez had a bad quarter. Both sales and earnings rose. But it wasn’t up to their standards or what they expect, as they make clear.

I’ll get to the numbers, but first I’d like to mention a few things they discuss in the 10-Q and conference call that highlight the issues all retailers are dealing with these days.

Zumiez ended the quarter with 616 stores; 557 in the U.S., 37 in Canada and 22 in Europe (under the Blue Tomato name). They are planning to open 57 more in fiscal 2015. There will also be some remodels and relocations of existing stores. 51 of the new stores will be in the U.S., six in Europe and I guess that means ten in Canada. I think they will end the year with something like 608 stores in the U.S.

They think they have lots of room to expand in Europe. Shall we think of Canada, as the conventional wisdom usually does, as 10% of the U.S. market, suggesting they might grow to perhaps 60 or a few more there?

In the past, they’ve talked about their limit for U.S. stores being around 700 as I recall. Might have been lower. They are starting to approach that. What happens then? Is that still a valid number?

Let me start by quoting CEO Rick Brooks from the conference call.

“We continue to see untapped potential in our North American markets and our goal is to maximize the long-term productivity of the entire portfolio by optimizing our physical store presence in each market as part of our omni-channel platform.”

“Our omni-channel strategy continues to drive expansion and enhancement of our digital infrastructure and shopping experience. With these investments, we’re able to better offer customers a consistent and genuine interaction with our brand regardless of the channel by which they’re engaging with us. We believe expansion in e-commerce works in tandem with expansion of our brick and mortar stores both domestically and aboard.”

And here’s what he says when talking about Europe. “We believe that our omni-channel strategy is going to win. Gerfried [Blue Tomato CEO and founder Gerfried Schuler] has been a big adopter of our omni-channel strategy. They are product lagging us in terms of some of our omni-channel efforts, just because of scale you have to have the physical scale to really rollout omni-channel initiatives. So Gerfried is as appropriate as rolling out the initiatives as they’re building marketplaces on that front.”

There are two things you should notice. The first is the unresolved issue of how many stores of what type you need where in the age of the omnichannel.   Can Zumiez still utilize 700 U.S. stores in the day of electronic commerce? Maybe they need more smaller ones? Or fewer but larger ones? That’s a question for every retailer. The question for Zumiez is what happens to store openings as they approach a possible limit in the U.S. Does the omnichannel let them continue to grow even with limited store openings? Or will store growth in Europe and to a lesser extent Canada replace that?

Second, note the comment about Blue Tomato in Europe not being big enough to take advantage of all the omnichannel things Zumiez is doing. For better or worse, the omnichannel strategy favors big players.

Okay, on to the next conundrum. Rick mentions, in discussing some difficulties they’ve had in the shoe category that they don’t and won’t carry basketball shoes, but that those shoes are very popular right now.

But he also talks about giving the customer what they want, when they want it, the way they want it. “…we don’t care what we’re selling, we just want to sell what customers want and our job is positioning inventory properly to do that.”

You can see an apparent conflict which I’ve sort of set up as a stalking horse. “Well Rick, if you basically follow your customers and give them what they want and they want basketball shoes….”

If I were Zumiez, I wouldn’t carry basketball shoes either.

We who were once unequivocally the clearly defined action sports industry finds that we have more or less migrated, kind of, to the less clearly defined active outdoor space with a lot more products and competitors. It used to be a whole lot easier to know which brands to carry.

Figuring that out is now a prime management function (or should be) at every retailer. Zumiez manages this in two ways. First, they are always searching for and supporting new brands. Second, they rely on their active outdoor oriented employees to spot trends and brands that might work for Zumiez. Getting enough of those people, we’re frequently told, is a constraint on their growth. That’s the case in Europe right now.

On to the third issue. In response to an analyst questions and talking about the general business environment Rick Brooks says, “ … we’re still in this kind of recovery, this bumpy recovery mode from the great recession and in these low volume periods is I think there the trends are — the lack of trend is more pronounced and that’s really what drives weaker traffic.”

He included the lack of trend issue when he earlier talked about foreign exchange and the West Coast port slowdown as having impacted the business. What concerned me, and where Rick and I might disagree, is that he talked about the lack of a trend and the bumpy recovery like he saw them as tactical short term issues- or at least that’s how it sounded to me. I see them as potentially long term and strategic.

An economy can only grow when either population or productivity grows, and we’re not doing very well in either category. I hope that lack of a fashion trend that motivates buying is a short term issue, but I have a concern that it might be a longer term trend resulting from our slow recovery and the particular difficulties it has visited on our target customers.

That’s an issue for brands and retailers alike- not just for Zumiez. I think you need to plan for an extended period of slow growth and a customer who’s tighter with their money.

Let’s move on to the numbers.

Zumiez’s sales rose 9% from $162.9 million in last year’s quarter to $177.6 million this year. North American sales were up $10.6 million or 7% to $161.2 million. European sales rose $4.1 million or 33.6% to $16.4 million. Comparative store sales rose 3% including ecommerce.

The gross profit margin rose from 31.0% to 31.8% mostly due to an increase in product margin. SG&A was up from $46.8 to $52.4 million or from 28.7% of revenues to 29.5%. Net income rose by 11% from $2.5 to $2.8 million.

The balance sheet was fine. There’s not a whole lot to discuss with regards to the specifics of the financials.

Feels like Zumiez’s issues are the same as those of other retailers and the key ones are long term and persistent.  I’d feel better if that was more directly acknowledged in the conference call, but I can’t really expect that. It continually amazes me that the analysts don’t ask about things that seem obvious to me. Perhaps that’s not appropriate etiquette in that forum or they get asked later in private conversations.

Zumiez has a head start over most of the industry with regards to the omnichannel. And their action sport/active outdoor employees will help them turn in the right direction. But it’s a hard time to be a retailer.

Terrain, Lifts, and Gravity: Advantages in Summer Activities; Thoughts on survival and what used to be the off season for winter resorts.

Summer has been a hot topic in resort circles for years. I’ve run a couple of snowboard companies so understand what extreme, snow dependent, seasonality means. I’ve visited resorts, written about resorts, but never worked for one. SAM, I think, thought I was the right balance of insider and outsider for this assignment.

At the beginning, this was supposed to be a straight forward article on summer business. I started with the simple idea that summer provides welcome cash flow in the off season. I figured out pretty quickly that summer activities at winter resorts is no longer an isolated topic, but part of the broader (and changing) circumstances winter resorts are facing.

That is, summer operations should be considered as one of the factors that will affect resorts’ success in the future. For some, summer ops could provide a bit of off-season cash flow; for others, it could become a major revenue source. I think there’s a group that’s going to need it to survive.

Read more