Zumiez’s Annual Results; And Tales from its Conference Call

My favorite part of a Zumiez’s conference call is when CEO Rick Brooks apparently decides the analyst has asked the wrong question or doesn’t quite understand the implications of what’s been asked.  Two plus pages of transcript later, sometimes ably supported by CFO Chris Work, we may have forgotten the original question, but we’ve always learned something new and intriguing.

So it was for the recent call discussing the quarter and year ended February 3rd, 2018.  But before we have that fun, let’s go through the numbers.

The Numbers

Fourth quarter revenues rose 16.9% from $263.6 to $308.2 million.  “Contributing to this increase were positive comparable sales growth of 7.5%, the net addition of 13 stores since the end of last year’s fourth quarter, the 53rd week in 2017 were $10.3 million and the positive impact of foreign exchange were at $5.3 million. Also benefiting fourth quarter 2017 net sales is an adjustment to deferred revenue related to our STASH loyalty program were $3.8 million,” explained CFO Chris Work.

The gross margin rose 1.5% to $37.2% compared to last year’s fourth quarter.  Chris notes, “The increase was primarily driven by 120 basis points of leverage in occupancy, 80 basis points related to the recognition of deferred revenue due to changes in our STASH loyalty program, estimated redemption rate, and 70 basis points of improvement in product margins. These increases were partially offset by 70 basis point increase in inventory shrinkage and 20 basis point increase in incentive compensation. Inventory shrinkage has been difficult for us in 2017.”

I’d say it has been.  When your improved product margin is 100% eaten up by disappearing inventory, it’s a problem. Zumiez has always tried to drive responsibility down to the store level.  Remember that a year or two ago, they transferred responsibility for online sales to their stores?  I’m wondering if that isn’t somehow related to the shrinkage problem.

SG&A as a percentage of sales for the quarter rose just slightly from 25% to 25.2%.  “The…increase was primarily driven by 100 basis point increase related to our annual incentive compensation partially offset by 40 basis points of leverage in our store operating cost and 30 basis points of leverage across other corporate costs.”  I never mind seeing incentive compensation expense rise, as it’s indicative of good results.

Net income for the quarter rose 9.6% from $18.2 to $19.9 million.  For some perspective, the chart below shows the quarterly results for the last two years.


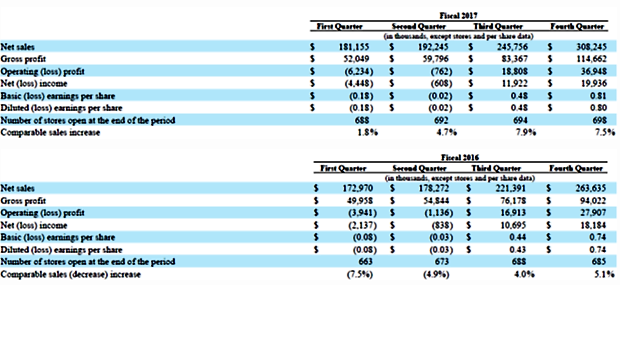
Zumiez ended its year with 698 stores; 607 in the U.S., 50 in Canada, 34 in Europe, and 7 in Australia.  The number of new store openings, especially in the U.S., is declining.  But Zumiez has been telling us that would happen for some years.  Over the last three years, stores opened has declined from 57 to 28 to 17.  The 2016 number of 28 was impacted by the acquisition of five stores in Australia.  The estimated number for this fiscal year is 13 new stores worldwide.

The chart below shows the composition of sales by category during the last two years.


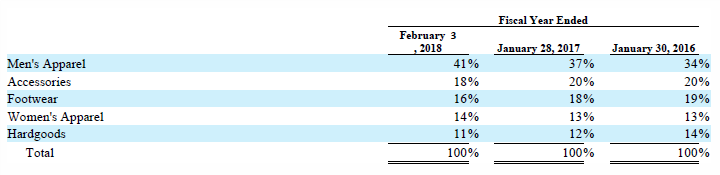
It’s always intrigued me to see how much revenue is from men’s’ apparel compared to women’s.  It seems unusual for a mall-based retailer (if I can still classify Zumiez that way?).  I don’t know if it’s a problem, an opportunity, or a competitive advantage.  Also note the decline in hard goods as a percentage of revenues- takes up a lot of room but doesn’t offer great margins.  But it’s an important part of Zumiez’s market positioning.

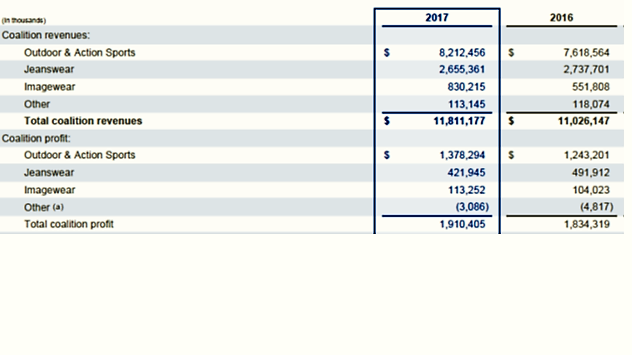
For the whole year, revenues roses 10.9% from $836 to $927 million.  Sales in the U.S. were $774 million, or 83.5% of the total.  In fiscal 2016, they were $711 million, or 85% of the total.  “The increase reflected a $48.6 million increase due to comparable sales and a $23.6 million increase due to the net addition of 13 stores (made up of 12 new stores in North America, 5 new stores in Europe, and 2 new stores in Australia offset by 6 store closures). Net sales include $10.3 million related to the additional week in the 53-week period and a $6.3 million increase due to changes in foreign currency rates.”

Zumiez’s business in Europe has not performed as management hoped.  They’ve had some losses there.  As Chris put it, “…we have not had the results from the investment we’re hoping [for].”  Rick Brooks talks about the “amazing results” they had in 2015 driven by a “…really huge long board trend and then in 2016 it basically completely reversed and of course we were still playing out as Chris said investing and building the business at that point when sales actually went – got considerably more difficult relative to what we assumed to be appropriate pace of growth at that point.”

By 2015, most of us were amazed the long board market hadn’t cracked already, but none of us had any doubt it was going to.  Because that’s what bubbles do.  If Zumiez was looking at success with their European acquisition that they could see was overly reliant on one product category, perhaps they could have called it out.  But who want to sound a note of caution on a new (second half 2012) acquisition you paid a hefty price for.

Zumiez launched “…over 150 new brands…” during the fiscal year.  It was just last year they were saying they tended to launch 100 a year.  These are not Zumiez owned brands, but brands where Zumiez works with the owner at various levels to launch them in Zumiez stores.

The gross margin rose to 33.4% from 32.9% the previous year.  “The increase was primarily driven by an 80 basis point impact due to leveraging of our store occupancy costs, 30 basis points related to the recognition of deferred revenue due to changes in our STASH loyalty program estimated redemption rate and 20 basis points on product margin. These were partially offset by 60 basis points in higher inventory shrinkage and 10 basis points due to higher annual incentive compensation.”

Net income rose 3.5% from $25.9 to $26.8 million.

There’s no need to discuss the strong balance sheet, except to remind you of the competitive advantage it offers, allowing you to pursue your strategy and initiatives even in the face of a bump in the road.

One last financial note before we get to the fun stuff.  Zumiez 10-K includes the following risk factor: “The reduction of total outstanding shares through the execution of a share repurchase program of common stock may increase the risk that a group of shareholders could form a group to become a controlling shareholder.”  It’s last in a list of many risk factors.

Companies, as you know, have been buying back their shares to boost their earnings per share.  Some (not Zumiez) have been borrowing money to do it and leveraging up their balance sheets.  We’ll see how that works out as interest rates rise.

Share buy backs are inevitably touted as a benefit to shareholders though you might also view buy backs as an admission by management that they can’t figure out any good investment opportunities in their business.  I find it amusing that this benefit requires a risk factor in the 10-K.  You might also consider that if the buy backs reliably raised the share price consistent with the reduction in shares outstanding, the cost to a potential controlling shareholder, in dollar terms, doesn’t change.  If that were the case, I don’t think a risk factor would be required.

Tales from the Conference Call

Now for the fun stuff.  I’m not going to start by reviewing Zumiez’s Competitive Strengths.  They are the same they’ve been for 20 plus years and, most importantly, work in any retail environment.  Instead, I want to remind you of two issues I’ve written about- not just related to Zumiez.

I’ve characterized the term “omni-channel” as the authoritative sounding word legacy brick and mortar retailers have used to make it sound like they’ve got things under control and know how to manage the brave new retail world where the consumer is in charge.  I’ve also stated that doing ecommerce right is a continuingly expensive undertaking.  Unless you can generate enough incremental revenue and operating income to at least pay for it, you are failing.

Being online- selling on line- having web sites and connecting ecommerce with brick and mortar do not represent a strategy.  They are the necessary tools for implementing a strategy.

“We believe now we’re entering into a new phase in servicing our customer,” says CEO Brooks, “moving beyond omnichannel into a new consumer environment with yet higher expectations. While we’re not sure what to call this new consumer phase, the New World will be characterized by key themes and words, such as trade area, localization, optimization, speed, intimacy, engagement, connection, innovation, and community.”

I’m relieved I’m not the only one who doesn’t know what to call it.  If Rick’s descriptors of the consumer environment are reasonably accurate, or at least not too far off from what the future holds, they are the basis for a strategy using the tools Zumiez has in place or is developing.  If forced to reduce his already short list of words, I come down to flexibility and informational immediacy.  Let’s talk about some things Zumiez is doing to succeed in the world Rick is describing.

As you know, Zumiez introduced 150 brands in fiscal 2017, up from around 100 the previous year.  At this point, I imagine Zumiez has a robust system for onboarding, and offboarding when they don’t work out, new brands.  In the environment Rick describes, imagine the value of seeing these new brands and the trends they may, or may not, represent when they are still small and, for lack of a better word, pure.  How else does a retailer find enough new brands to satisfy the consumers’ requirement for constant newness?

Zumiez’s largest third-party brand accounted for 8.5% of revenues in 2017.  That’s up from the previous two years.  Meanwhile, Zumiez’s private label revenues have fallen over three years from 21% of revenues to 20.2% and 16.8% in 2017.  Given the emerging competitive environment, I wonder if the Zumiez management team might not be conflicted if private label (regardless of the margin) grew too much or a single brand became a larger chunk of total third-party revenues.

Obviously, Zumiez’s size and resulting ability to support the new brand process gives it an advantage.  Here’s how they describe it in the 10-K.  “Given our scale and market position, we believe that many of our key vendors view us as an important retail partner. This position helps ensure our ability to procure a relevant product assortment and quickly respond to the changing fashion interests of our customers. Additionally, we believe we are presented with a greater variety of products and styles by some of our vendors, as well as certain specially designed items that we exclusively distribute.”

Zumiez’s new brand process isn’t restricted to the market the brand originated in.  Says Rick, “…we have brands as well as trends that are already flowing across the oceans for us and working on multiple continents.”

Finally, Ricks longest answer to a short question highlighted another Zumiez’s advantage I, I’m embarrassed to say, hadn’t focused on before.  You know that Zumiez has trade areas, and the goal is to maximize revenue from that area, not just to open new stores in it.  You might find yourself closing stores to grow revenue.  You also know that Zumiez has transferred ecommerce fulfillment to their stores.  I always thought that was a great marketing/customer relations thing to do.

I hadn’t focused on the financial benefit.

“…when our web business grows digital sales today, we’re now able to lever physical store, our physical store cost structure,” says Rick.

“Lever our physical store cost structure.”  Just a few little words.  Where the hell has my mind been!  Zumiez is in the process of solving the problem of making the cost of the “omnichannel” pay off.  By having fulfillment done through the stores they’ve made what used to be two cost centers into one and made that one more efficient.  Completely in sync with their customers, Zumiez literally doesn’t even have to think about whether it’s an ecommerce or a brick and mortar sale.  They don’t care because there’s largely just one cost structure.  Rick continues:

“…this is one of the measures of what you mean when you say you have an integrated seamless experience right, you have to integrate it into everything you do in the service of customers. And of course our store teams and digital sales teams they all work as an integrated unit now, looking at all the touch points and how we can best drive consumers to whatever channel the empowered consumer prefers.”

“Probably the easiest example, Sharon, I could give you of evidence here about this idea of how we’d recreated this kind of new integrated business model is localized fulfillment. So through localized fulfillment and in particular already our order routing algorithms, we’ve now levered store payroll and our other store cost structures in two successive holiday seasons. And when I hear a lot of retailers talk, they talk about how a significant growth in web revenue is de-leveraging their business.”

Brick and mortar retailers were initially dragged into ecommerce as a defensive measure focused on giving their customers what they wanted.  Zumiez has said that with their trade areas, new systems, and brick and mortar responsibility for ecommerce, they have figured out how to synchronize market and financial imperatives.

Can you make ecommerce a competitive positive if you don’t do that?  I’m guessing no and expect all successful retailers with a brick and mortar footprint to have to do the same as Zumiez.

VF’s Management Process and Strategy: Thoughts on Their Annual Report

I’ve spent some time on VF’s 10-K filing for the year ended December 31, 2017.  It was a thought provoking read (yes, I know I’m the only one who would say that about a 10-K) that left me thinking about how VF tries to derive its competitive advantage.  There are some lessons in it for all of us who sell products that are an awful lot like your competitors’ products.  Here are some VF facts on which we can base the discussion.  I’ll also review their numbers for the year.

  • More than 30 brands (23 of which they call primary) divided into three segments; Outdoor & Action Sports, Jeanswear, and Imagewear. Vans, The North Face, Timberland, Wrangler and Lee are the five largest.
  • They sell through specialty stores, department stores, national chains, mass merchants, and through theirs owned brick and mortar and online retail. In international markets, they also sell through licensees, agents, distributors, and independently operated partnership stores.
  • 65% of revenue is from the Americas, 24% from Europe, and 11% from Asia-Pacific region.
  • Total revenue for the year was $11.8 billion.
  • Direct to consumer revenues were 32% of total revenues. At the end of the year they had 1,518 stores worldwide, opening 111 in 2017.  They also have 1,100 “concession retail stores” mostly in Europe and Asia.
  • Vans, Timberland, The North Face, Kipling, Dickies, Lee, Napapijri, and Wrangler have stores under their names that sell only that brand’s products. There are also 80 outlet stores that sell many VF brands.
  • Ecommerce is 21% of direct to consumer.
  • VF owns 21 factories and produced 23% of 473 million units there. It works with approximately 1,000 other factories in 50 countries.  It has 38 distribution centers.

Consider the complexity.  How many combinations of where it’s made, where it’s sold, how it’s distributed, who the customer is and how the brands are positioned against each other (where that’s an issue) are there?  That’s a big, big number.  To some extent, it’s simplified by the fact that the five largest brands are a big chunk of total revenue, but still, this is quite a management challenge.  Here’s how they describe part of it in the 10-K.

“Managing this complexity is made possible by the use of a network of information systems for product development, forecasting, order management and warehouse management, along with our core enterprise resource management platforms.”

Talking about how VF manages its manufacturing base, the 10-K says:

“Products manufactured in VF facilities generally have a lower cost and shorter lead times than products procured from independent contractors. Products obtained from contractors in the Western hemisphere generally have a higher cost than products obtained from contractors in Asia. However, contracting in the Western Hemisphere gives us greater flexibility, shorter lead times and allows for lower inventory levels. This combination of VF-owned and contracted production, along with different geographic regions and cost structures, provides a well-balanced, flexible approach to product sourcing.”

CEO Steve Rendle’s nearly full-time job must be getting quality people he trusts into the right positions.  They had 69,000 employees at the end of the year.  He notes in the conference call, for example, “To support the execution of our strategy and better enable the growth of our large global brands, we have realigned the roles of our Group Presidents and redirected our leadership talents at our most important objectives. Going forward, each Group President will be responsible for a single geographic region and have one global brand reporting to them.”

So, what are the foundations VF builds its business on?  People (like any organization), systems, procedures, and disciplined management processes.

Oh – wait – I didn’t say brand or product.  From the 10-K: “In addition to the design functions of each brand, VF has three strategic global innovation centers that focus on technical and performance product development for apparel, footwear and jeanswear. The centers are staffed with dedicated scientists, engineers and designers who combine proprietary insights with consumer needs, and a deep understanding of technology and new materials. These innovation centers are integral to VF’s long-term growth as they allow us to deliver new products and experiences that consistently delight consumers, which drives organic growth and higher gross margins.”

I’m guessing they have one innovation center focused on each of their geographic areas.  For certain of their brands (surely the top five) they have enough size to develop, if appropriate, area specific product.

They can do this because of their size.  But size can be dysfunctional if you don’t have the four foundations I mention above.  What are the other benefits of being this big and managing like VF tries to?

Higher gross margin.  Your volume, number of contract manufacturers, and having your own factories will give you some advantage.

Lower advertising and promotion expense as a percent of sales.  They spent $716 million, and in fact have accelerated their brand building spending, but it was just 6% of revenues.

More flexibility and faster response to market changes.  Anybody think that’s competitively useful these days?  It’s valuable in brand building but having the ability to make some product quickly and perhaps in smaller quantities rather than making too much of the wrong stuff is also good for your margin.  There’s also value in having a distribution network that lets you move product around in response to changes in demand.  Also improves inventory control which, I believe, helps with brand building.

The cost of increasingly complex logistics and important systems is more efficiently spent.  That is, VF, as an $11 billion business, doesn’t have to spend 11 times as much as a $1 billion business.

As I watch companies like VF focus on flexibility and shorter product cycles, I continue to wonder about the changing role of trade shows.  For certain products, they seem built on the assumption of product cycles that increasingly don’t address what the market and end consumer want and when they want it.

Let’s move on and look at the numbers.

VF showed a revenue increase of 7.1% in 2017 from $11.0 to $11.8 billion.  $489 million was from existing brands and $247 million from the Dickies acquisition.  $49 million was from a positive foreign currency impact.  The gross margin improved 1.2% to 50.5%. “…reflecting a 180 basis point benefit from pricing, a mix-shift toward higher margin businesses and lower restructuring costs, which was partially offset by a 60 basis point impact from foreign currency.”  SG&A expenses grew 11.9% from $3.99 to $4.46 billion.  As a percentage of revenues, it was an increase of 1.6%.  “This increase is primarily due to investments in our key growth priorities, which include direct-to-consumer, product innovation, demand creation and technology initiatives. The increases were offset by lower restructuring costs in 2017 and a pension settlement charge of $50.9 million in 2016, which did not recur in 2017.”

Operating income rose from $1.368 to $1.503 billion.  Interest income rose from $9.2 to $16.1 million while interest expense was up from $94.7 to $102 million.

Income taxes rose from $206 to $695 million.  The new tax law passed in December resulted in a $465.5 increase.  That’s tax on income that had been earned and held offshore.  It’ a one-time thing.  The result was a 42.7% decline in net income from $1.07 billion to $615 million.

As you probably know, VF acquired Dickies in 2017 and has put Nautica up for sale.  On the income statement, they separate discontinued operations, and provide separate information on the late in the year acquisition of Dickies.  I’m not breaking any of that out in my discussion and want to explain why.

The first of four long term drivers of their strategies is, “Reshape our portfolio. Investing in our brands to realize their full potential, while ensuring the composition of our portfolio positions us to win in evolving market conditions.”  Buying and selling brands is part of their normal operations.  They are very disciplined about what they buy and how much they will pay.  They don’t necessarily buy something every year, but it’s an active and ongoing part of their operations and I don’t believe in viewing their results net of it.

Acquisitions remain a top priority for VF as they are “…transforming VF into a more digitally-enabled consumer and retail-centric organization.”

Below are revenues and operating income by segment- what they call coalitions.  The key thing to notice is that Outdoor & Action Sports provided 69.5% of revenue and 72% of operating income.


Vans’ revenues were up 17% in 2017.  The North Face was up 4% and Timberland 2%.   Total segment revenues were up 8% for the year.

“Global direct-to-consumer revenues for Outdoor & Action Sports grew 17% in 2017, driven by an expanding e-commerce business, comparable store growth and a 1% favorable impact from foreign currency. Wholesale revenues increased 2% in 2017, driven by growth in the Vans brand and Europe, partially offset by the above-mentioned U.S. retailer bankruptcies, lower year over- year off-price shipments and efforts to manage inventory levels in certain markets.”

The dominance of and dependence on Vans, as well as its continued and rapid growth is rather remarkable.  You won’t be surprised to learn that CEO Rendle lists “…protecting and enabling the explosive growth in Vans…” as the first of their 2018 top priorities.  VF expects “…high-teen growth from Vans through the first half of this year.”

During the conference call, an analyst asks the following question, which has been on my mind for a while as well.

“You talked about protecting the brand. You talked about not letting it overheat. What does that mean to how you’re going to manage the brand into the wholesale channel and your DTC, right? Are you going to constrict some of the deliveries into the wholesale channel? Are you going to limit some of the inventory across the channel? Are you going to segment the styles further? How do you plan to maintain a double-digit growth rate, as you alluded to, so that this doesn’t roll over, like we’ve seen other brands do in the not-too-distant past?”

Good question.  You can read into it the inevitable and often discussed in Market Watch public company problem; How do you grow without screwing up the brand?  Here’s part of Steve Rendle’s answer.

“…our Vans team is really the benchmark business on how they look at product segmentation across the different consumer touch points that we have to sell into, with our stores being the most premier expression of our brand. They’re really evolving how they’re looking at using stores and coming up with a mix of formats that play into the specific communities across the globe, but being very thoughtful, and direct partnerships with those wholesale partners, placing the right amount of inventory, being very thoughtful about not having one style over-torque, but really having it be a balanced approach with the right amount of newness to keep the brand moving forward each season.”

His answer sort of comes down to, “We manage the brand better than other brands are managed.”  Apparently so.  Yet it doesn’t really address the public company conundrum and I’ve never known a brand that didn’t, eventually, hit a dump in the road- “roll over” as the analyst puts it.  And I wonder, given the relative growth rates, why they can’t manage The North Face and Timberland as well as they are managing Vans.  It has something to do with the brand and the competitive environment, not just the brand management it seems.

Given the dependence on Vans, I hope they can continue to be disciplined in how they grow sales while protecting the brand.

A quick note on “risk factors” as listed endlessly in the 10-K.  I used to spend a lot of time on them.  Now, I find myself skimming them and rarely having anything to say about them- and not just for VF.  That’s because risk factors seem to be evolving from meaningful business considerations to a list of anything that the lawyers think could possibly go wrong.  They aren’t written to inform investors as much as to protect the company.

The balance sheet is weaker compared to a year ago.  Total equity fell 25% from $4.9 to $3.72 billion.  The current ratio is down from 2.4 to 1.5 times and cash declined from $1.227 billion to $566 million.  Debt to total capital was up from 31.9% to 44%.

The growth in receivables and inventories seems consistent with revenue growth and the acquisition of Dickies.  Also due to the Dickies acquisition, short term debt jumped from $26 to $729 million.  Hope they can refinance that before rates rise.  Long term debt was also up a bit from $2.04 to $2.19 billion.

The percent of their earnings they paid out as dividends was 96.2%.  That’s up from 59.9% last year and 38% in 2013.  It’s not that the balance sheet is weak- it’s just not as strong as it was.  If I were an investor in VF, the balance sheet changes and payout ratio would leave me wondering what happens if Vans should hit that bump.

The majority of VF’s growth for the year came in it’s fourth quarter, when revenues jumped 20.5% from $3.04 to $3.65 billion.    They reported a loss of $90 million in the quarter but remember the big accrual for taxes they were required to take due to the new tax law.  Vans, by the way, was up 35% in the fourth quarter, which puts some perspective on the 17% growth for the year.

Like all companies, VF tries to put its best foot forward in its public filings and conference calls.  I’m sure they have as many things go wrong as the next company.  Still, I walk away from reading their 10-K (and that of some other companies) with a strong sense that what used to give smaller companies a chance for an advantage is no longer exclusively available to those smaller companies.

Revenues Flat, But Strong Bottom Line Performance; Globes Half Year Results

Globe’s report for the six months ended 31 December 2017, as usual, gives us very little information.  The only 17 page report makes just one incomplete mentions of their brands and tells us exactly nothing about how any of them are doing individually.

Perhaps I’ll start by reminding you of their brands.  They own are Globe, Salty Crew (50% I think), FXD, Dwindle, Enjoi, Blind, Darkstar, Almost, Tensor, Dusters and Sample.  Their third party brands, which means they distribute them, are Stussy, Obey, M/SF/T, Xlarge, Andale, Kryptonics and Hardcore.

Total revenue, compared to the same six months the previous year, fell by 0.71% from $70.7 to $70.2 million (all numbers are in Australian dollars).    Pretax income, on the other hand, rose 24.1% from $2.81 to $3.49 million.  How’d they do that?

“This growth in profitability was due mainly to an increase in gross margins across the board. The gross margin improvement came from a combination of factors including brand mix, customer mix, sourcing improvements and foreign exchange impacts. While overall costs were largely flat compared to the same period last year, there has been a reallocation of costs towards emerging and growth brands, to drive the growth in those brands over the coming years.”

Revenues from the Australasia segment fell from $41.3 to $38.3 million.  However, the segment earnings before interest and taxes (EBIT) was up just a bit from $4.95 to $5.06 million.  In North America, revenue rose 13.4% from $17.75 to $20.13 million.  The EBIT loss improved, declining 41% from a loss of $2.15 million to a loss of $1.27 million.  In Europe, revenues were little changes, rising from $11.68 to $11.76 million.  However, EBIT fell from $284,000 to $83,000.

From a bottom line perspective, then, Australasia is carrying the load.  North America is losing money and Europe is barely above breakeven.

I don’t know what the change in gross margin was.  Of the factors they point to as responsible for the improvement, I’d be curios how much foreign exchange accounted for.  But fundamentally, they leave us with a picture of a company that’s managing its brands, distribution and customers consistent with a competitive environment where revenue growth is harder to come by.  I’d call that being in touch with reality.  Globe has tended to be that way.

Changes in the balance sheet, which is strong, are consistent with management’s description in the quote above of what led to the gross margin increase.  With revenue more or less constant, we see an 8.6% decline in inventory from $19.2 million a year ago to $17.6 million at 31 December 2017.  I also note that a current interest bearing liability of $4.59 million last year is down to zero this year while cash and cash equivalents is basically unchanged.

Based on the very limited information in the report, Globe is positioned to do well if its competitors struggle for whatever reason.

One Last Time! Billabong Reports Its Half Yearly Earnings.

Thursday’s earnings call by Billabong for the six months ended 31 December 2017 was its last unless something unexpected happens.  With an anticipated late April closing of the acquisition of Billabong by Boardriders for $1.00 a share, with Billabong ending up private, we won’t be seeing any more of the company’s numbers.

Everybody knows that and as a result the call, in a word, was perfunctory.  Current CEO Neil Fiske and CFO Jim Howell went through the numbers without some of the usual details, explanations, and nuances.  I think there was only one analyst with any questions.  I wonder how many even listened.

Read more

Insights on the Sale of Billabong to Boardriders

On February 14th, Billabong released a 194 page document explaining the deal under which Boardriders (formerly Quiksilver and owned by Oaktree) will buy it for $1.00 a share (all number in Australian dollars unless otherwise noted).  You can go to this page and click on “Court Orders Convening of Scheme Meeting” to download the document as a PDF.  It includes the independent expert’s report prepared by Grant Samuel & Associates Pty Ltd (“Samuel”) explaining and justifying the purchase price.

Perhaps the best way to start is to review a little industry history.  I posted a link to “Subcultural enterprises, brand value, and limits to financialized growth: The rise and fall of corporate surfing brands” last year.  Here’s the link again.  Those of you who didn’t read this study ought to take the time.

We learn that the deal is expected to close on April 24th.  In a strategic sense, despite the length of the document we don’t learn much that’s new.  Some of the comments on possible synergies from the combination are interesting and there are some new facts/opinions we’ll get to.  Let’s get started.

Read more

Trade Shows and Scooters

I’m back from the first combined Outdoor Retailer/Snow Show trade show in Denver.  The most impactful thing I brought back from the show was the flu.  You guys who had dinner with me Thursday night- let me know if you got it.

You know, last year I came home from Denver with what turned out to be pneumonia.  Two years before that I was hospitalized in Denver with a staph infection in my knee.  I don’t know- maybe I’d like to see us back in Vegas.  I never got sick there.

Read more

Speaking of Consolidation- Boardriders’ Acquisition of Billabong

Back in September of 2013, when Centerbridge and Oaktree invested in Billabong, there was some discussion/consternation about the possibility of Oaktree combining Quiksilver, which it already controlled with Billabong.  Quiksilver’s name, as you know, was changed to Boardriders.  It owns the Quiksilver, Roxy and DC brands.  Billabong’s three largest brands are Billabong, RVCA, and Element.  It also owns some smaller brands which I continue to expect will be sold.  Probably easier to do that once Billabong is not a public company.

Read more

Agenda Was Kind of Slow Last Week

In the past, I’ve been more than willing to criticize trade shows, suggest changes, and express our mutual uncertainty as to what the role of trade shows should be and how they should perform that role.  Even recognizing that the winter Long Beach Agenda typically has lower attendance than summer, I was surprised at the low attendance and the brands that did not attend.  I also heard from more than the usual number of brands that attended only because they got free booth space.

Read more